> ## Documentation Index
> Fetch the complete documentation index at: https://mooncamp.com/docs/llms.txt
> Use this file to discover all available pages before exploring further.
# Dashboards
> An overview of Dashboards for goals and OKR reporting.
Dashboards are available for customers in the `Pro` and `Enterprise` plan. The [Progress Dashboard](/progress-dashboard) is free for all plans.
## Dashboards explained
Dashboards can be configured freely and used to visualize any kind of data within Mooncamp for the reporting of your OKRs and beyond. A dashboard is organized in rows, and each row can contain one or more content cards that you can resize and rearrange.
Dashboards can be displayed publicly or privately and can be shared with chosen [access groups](/access-rights). This makes them especially helpful for management or department meetings, or any other use cases that might require privacy.
For inspiration, see the [Dashboard Examples](#dashboard-examples) section below.
## How to use Dashboards
To create a new dashboard, navigate to `Tools > Dashboards` and click **New dashboard**. You can then add content to your dashboard by clicking the `+` button on the side or at the bottom of a row. Available content types include:
* [**Chart**](/custom-charts): Custom charts to visualize goals, check-ins, and goal updates (column, bar, line, donut, number, and table). Also includes preconfigured chart templates for Goal progress, Status distribution, Status score, and Goals by status.
* **Goal**: Display the progress of a single goal as a line chart or metric. You can select a goal, choose the display type, and optionally compare progress to a previous date (one day, one week, one month ago, or a custom date).
* **Lists**: Goal lists, Check-in lists, Update feeds, or Member lists with filters and sorting.
* **Text**: Free-form text fields for notes, descriptions, or context.
* **Media**: Upload images or embed video links.
* **Embed**: External content via iframe (see [iframe embed](#iframe-embed) below).
You can resize and rearrange cards on the dashboard using drag and drop. Each card has a menu in the upper right corner for additional options like duplicating or deleting it.
### Duplicating dashboards and cards
To **duplicate a dashboard**, navigate via `Tools > Dashboards` to the overview that shows a list of all your dashboards. Hover over the dashboard you would like to duplicate and use the right-click menu to do so. To **duplicate a card** on a dashboard, use the menu in the upper right corner of the card.
### Favourites and export
You can favourite dashboards to your sidebar so your most important data is always one click away.
Via the ellipsis `…` in the upper right corner of the screen, a dashboard can be exported as a **PDF or PNG file**. For details, see [Exporting Content](/exporting-content).
## Dashboard Examples
A few of many potential use cases can be the following:
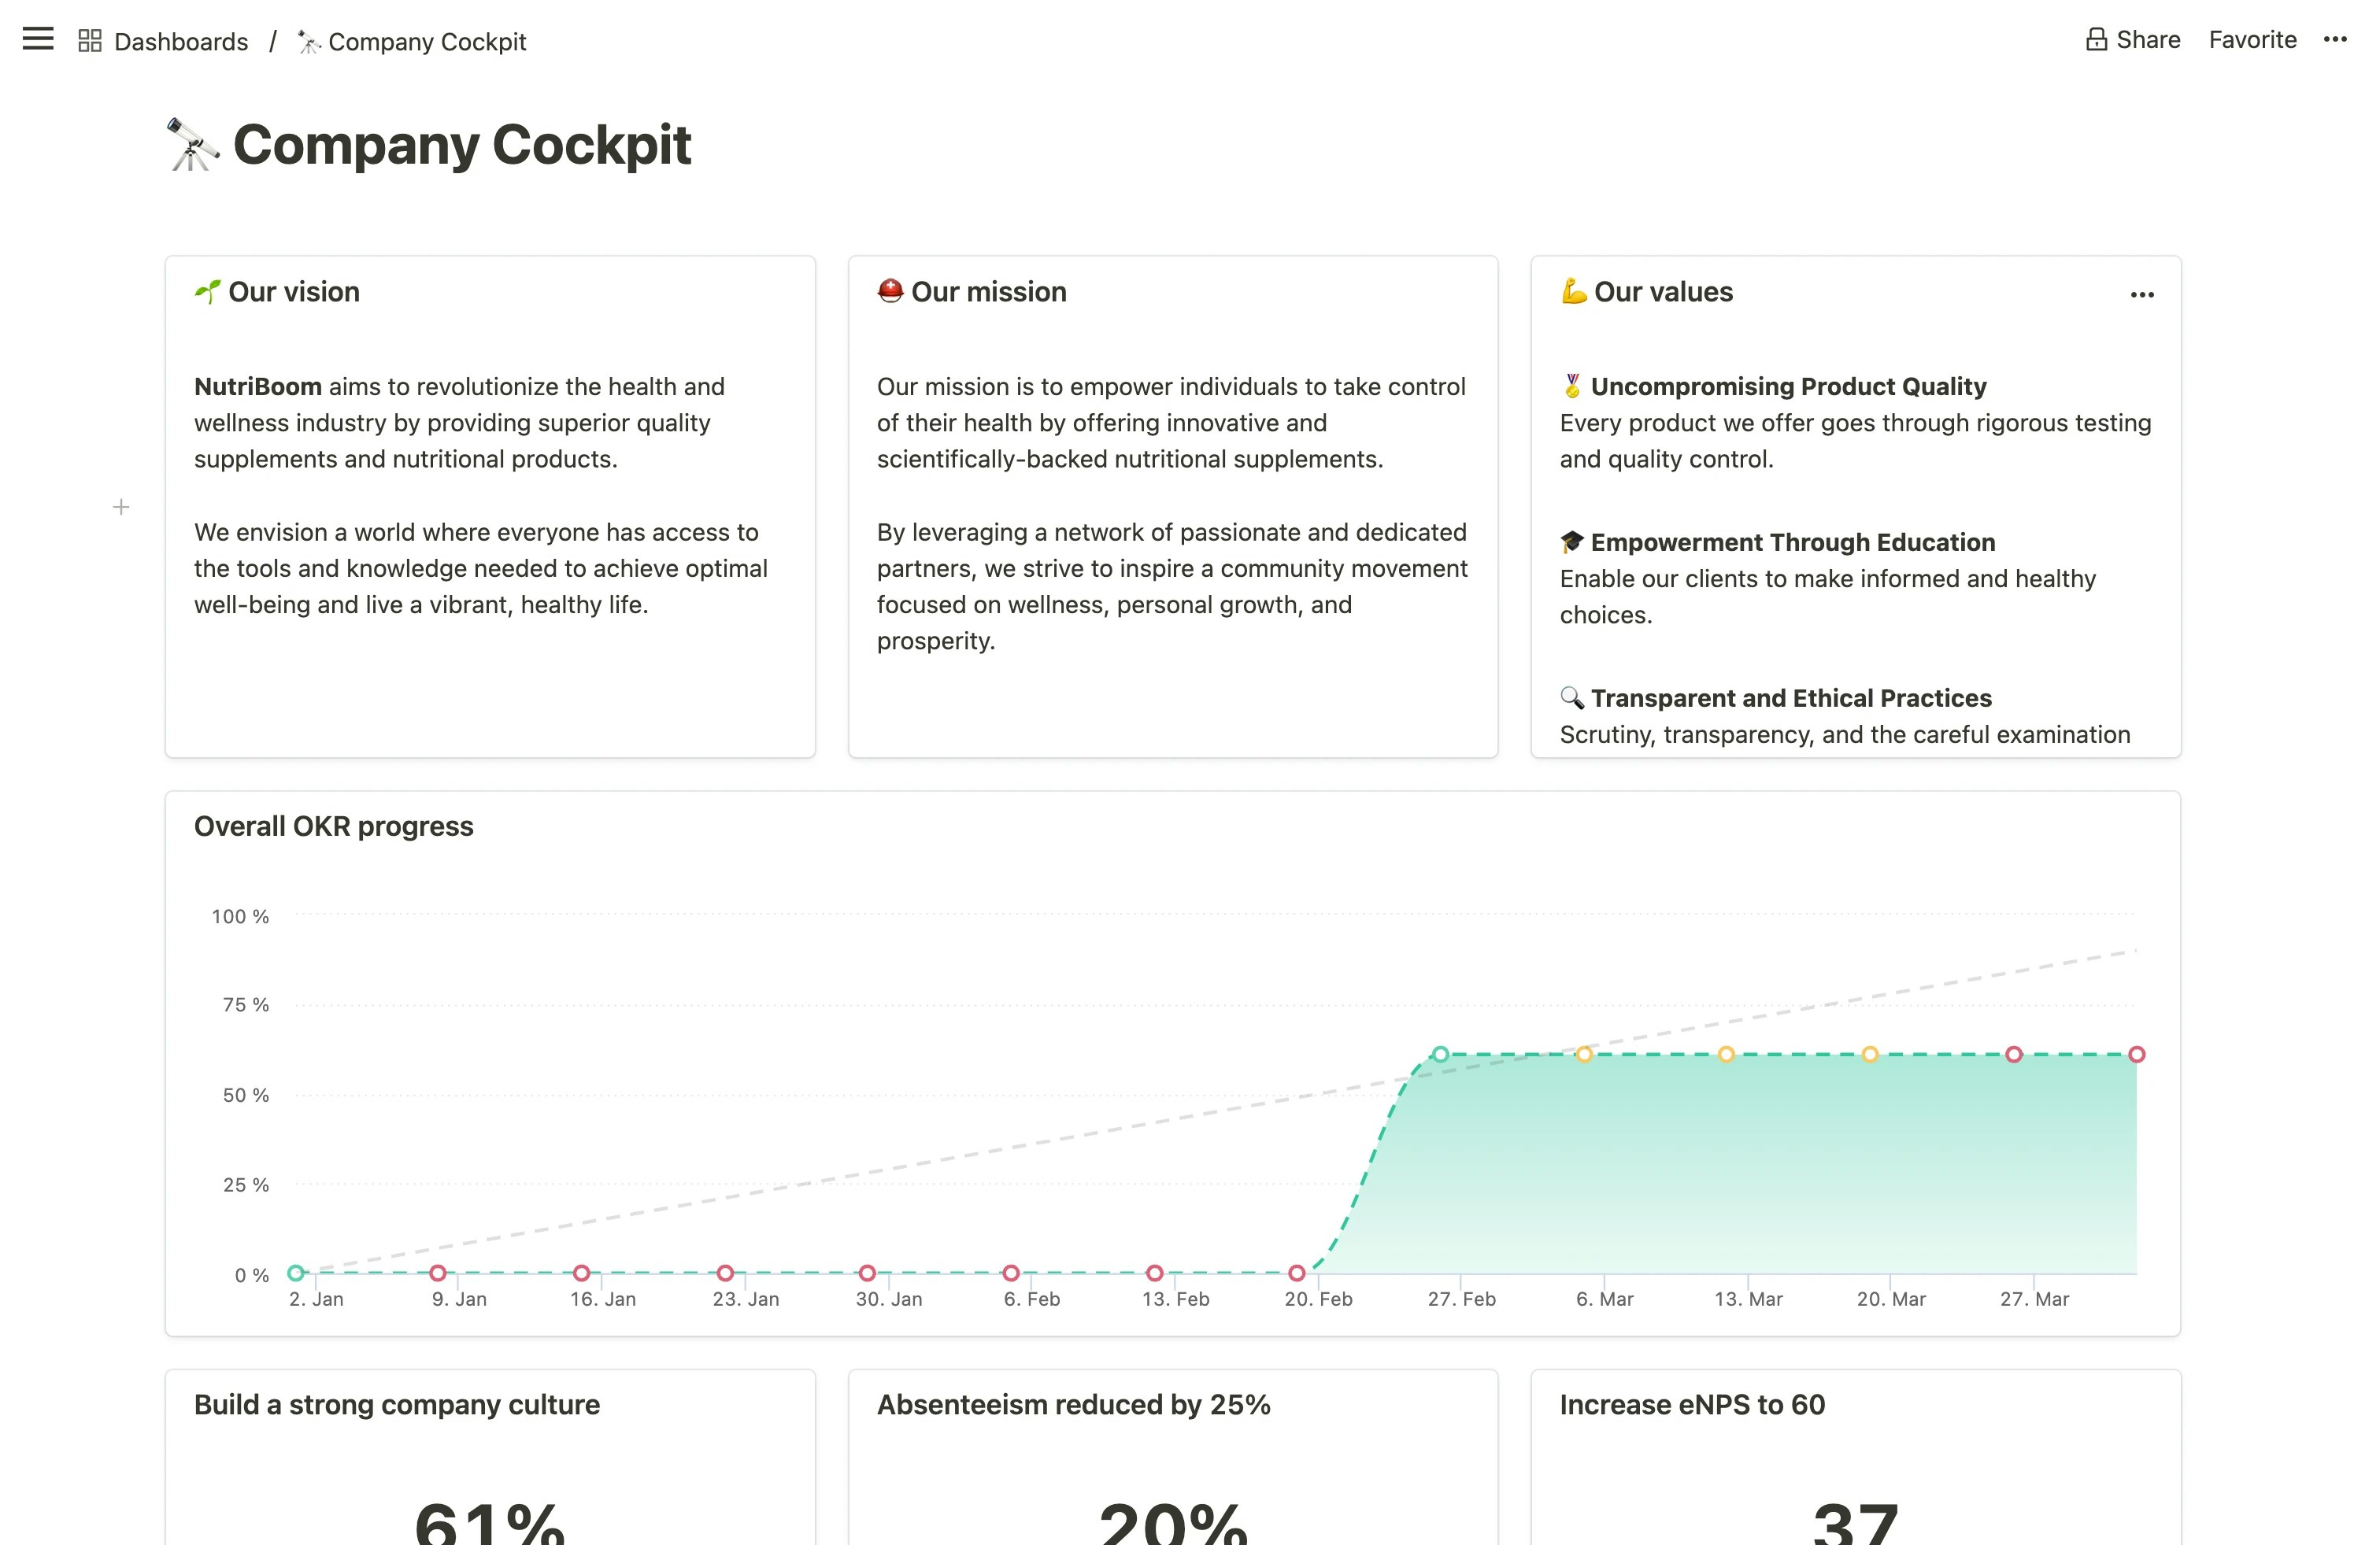
* **Company Cockpit:** An executive summary encapsulating the company's vision, mission, and values, as well as top-level KPIs and overall OKR progress.
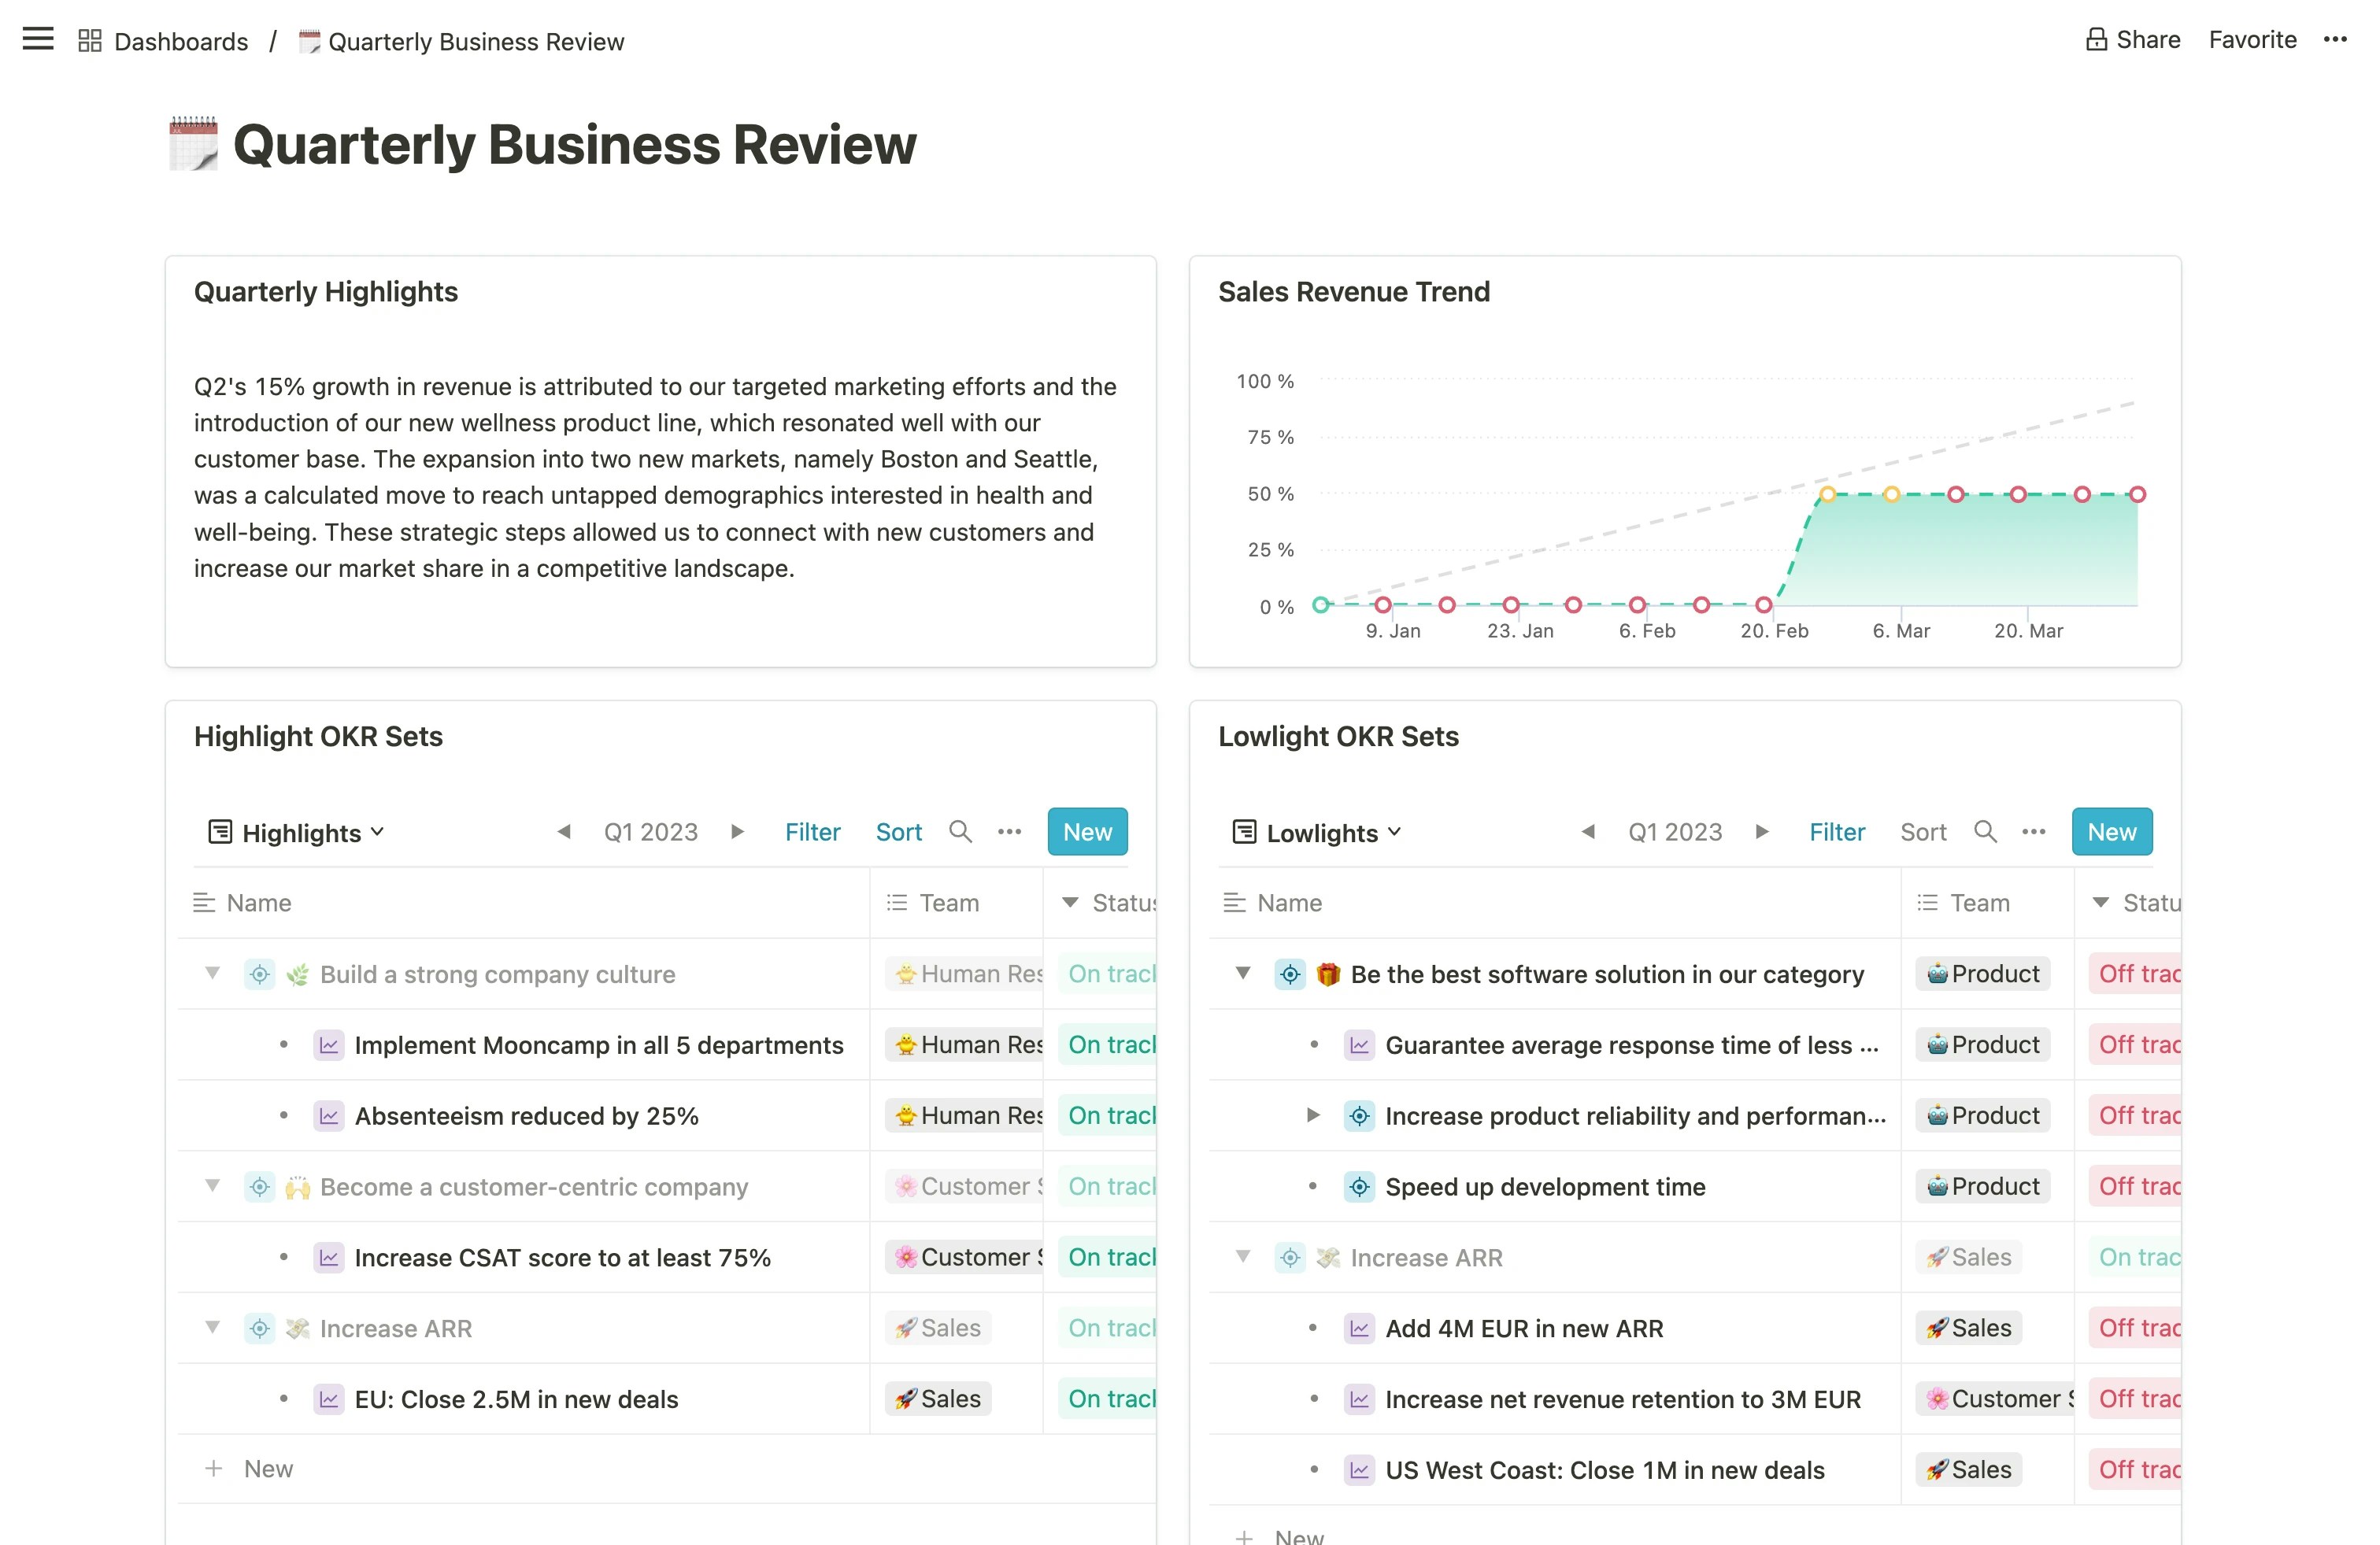
 * **Quarterly Business Review (QBR):** An in-depth analysis of quarterly achievements, growth, challenges, strategic initiatives, as well as OKR highlights and lowlights.
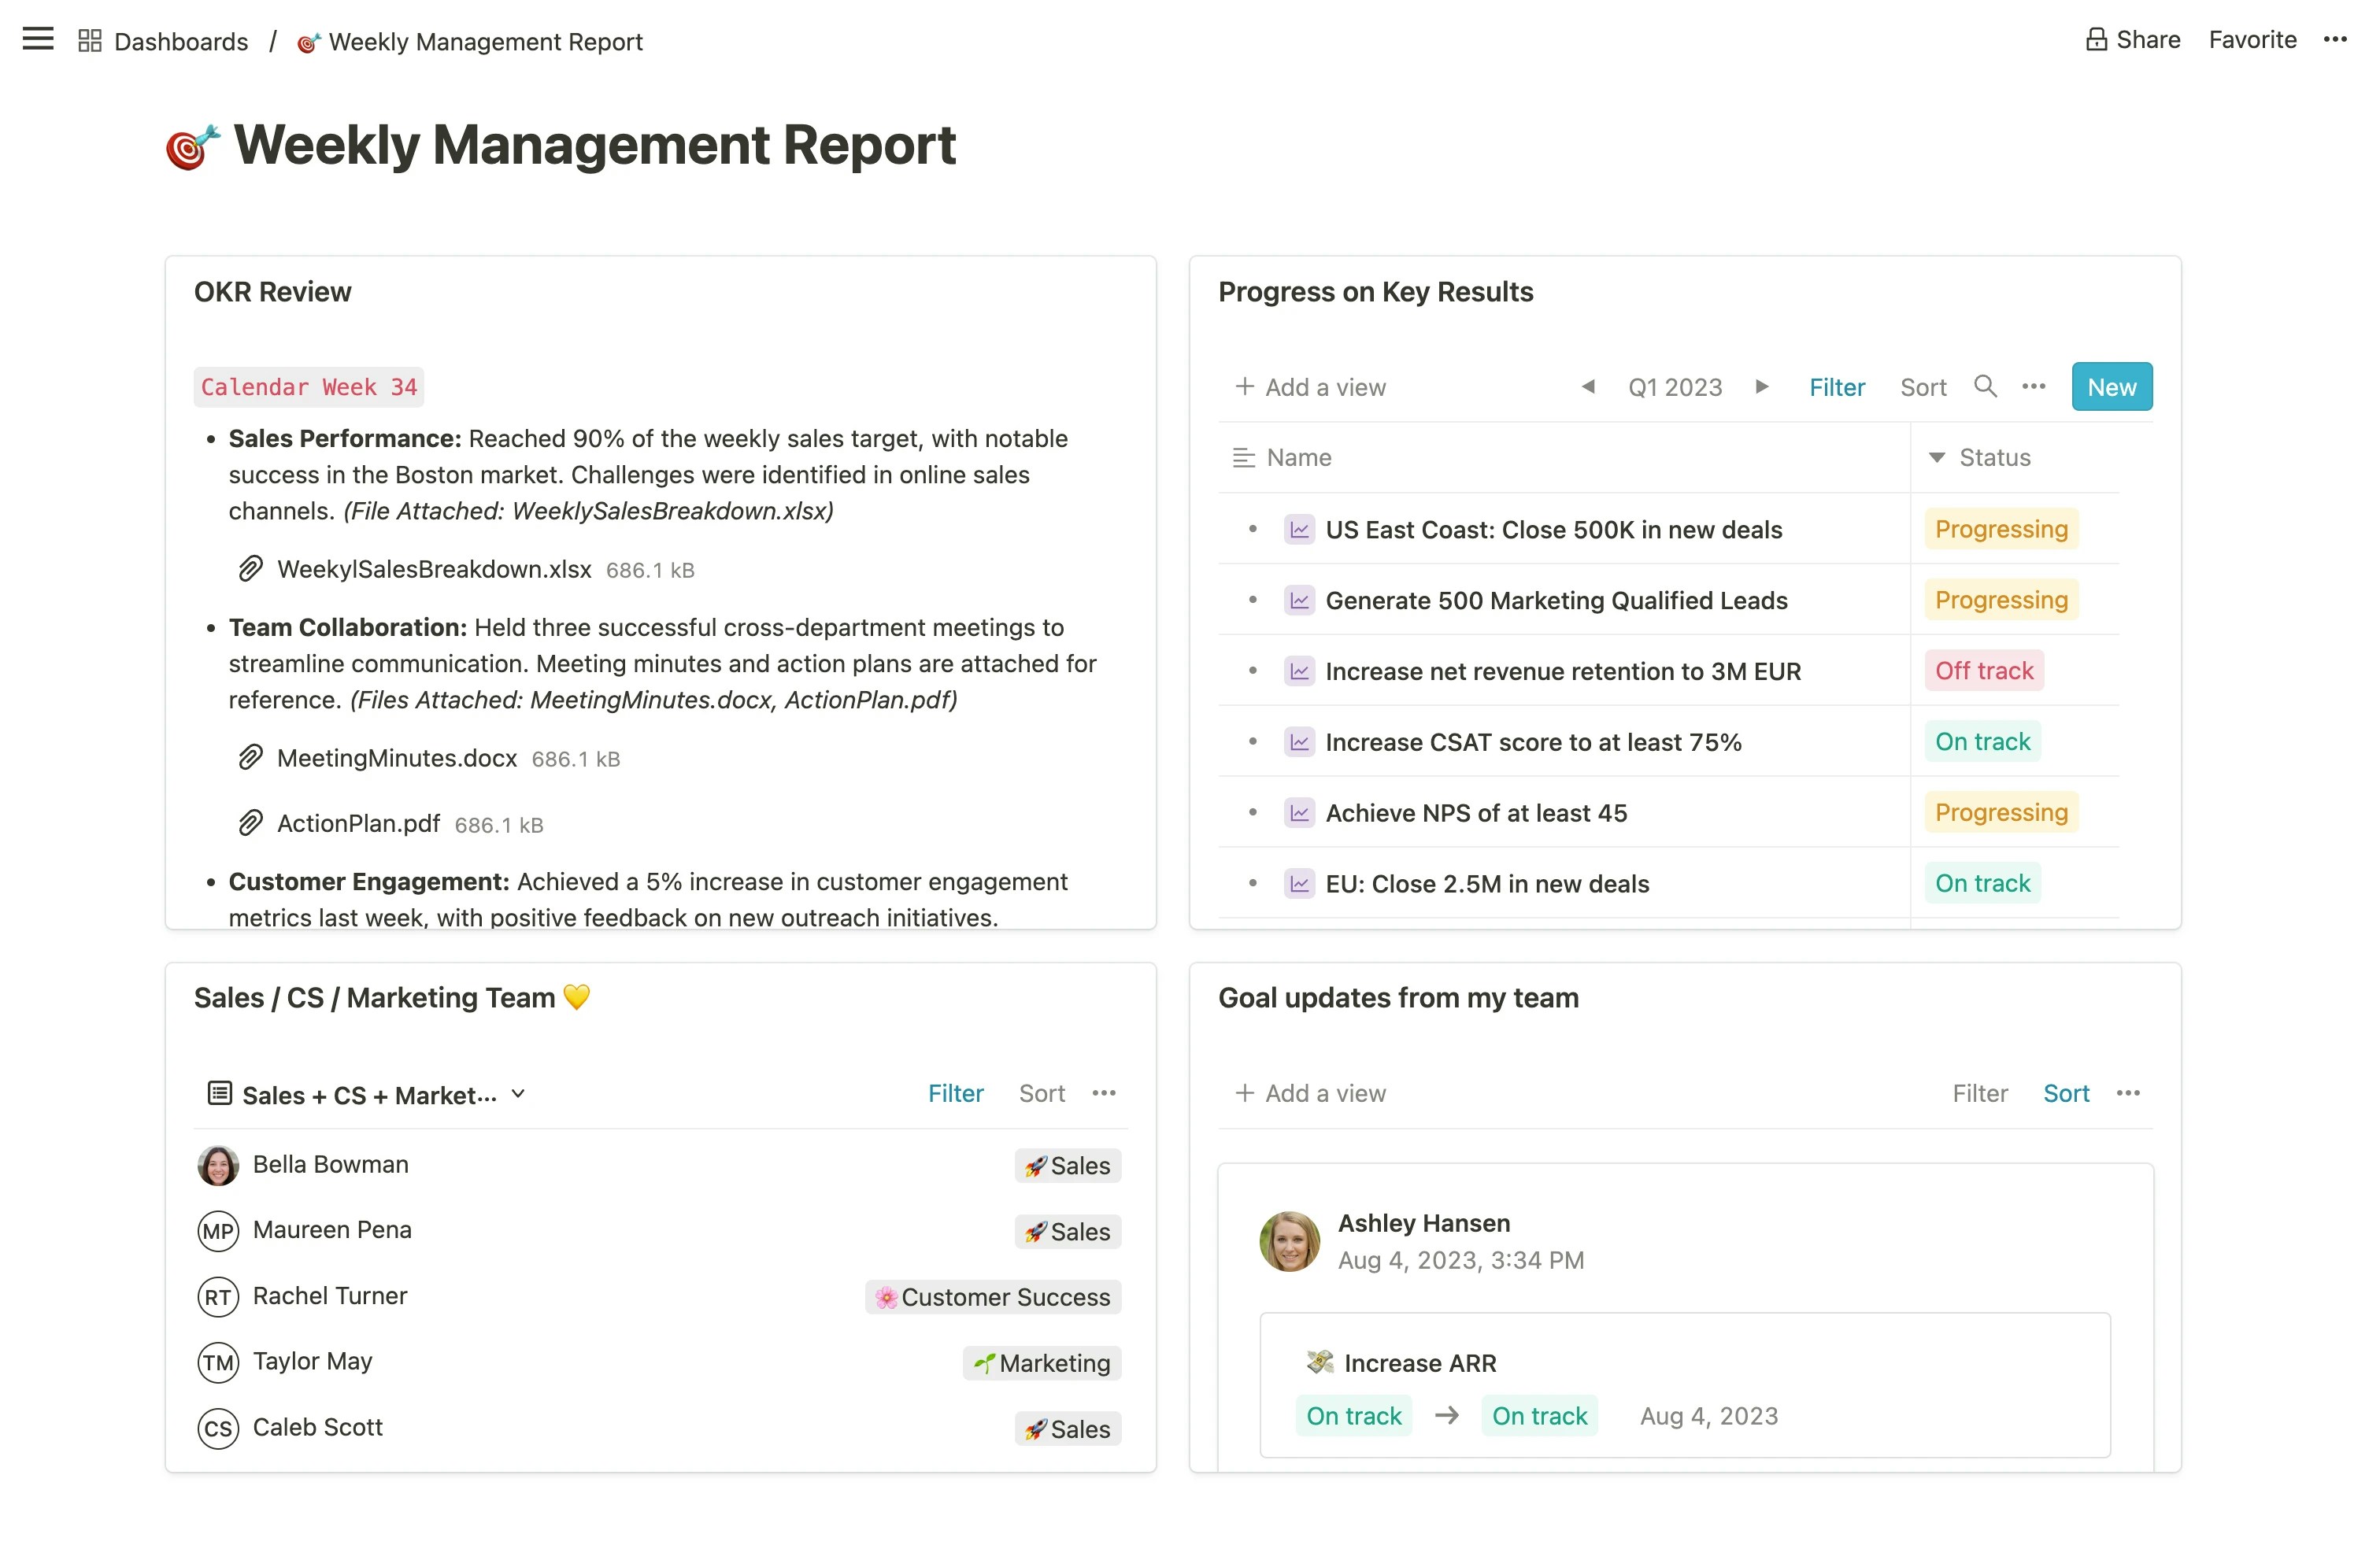
 * **Weekly Management Report:** A report that highlights key accomplishments, challenges, and focus areas for the week, aiding in short-term decision-making and planning.
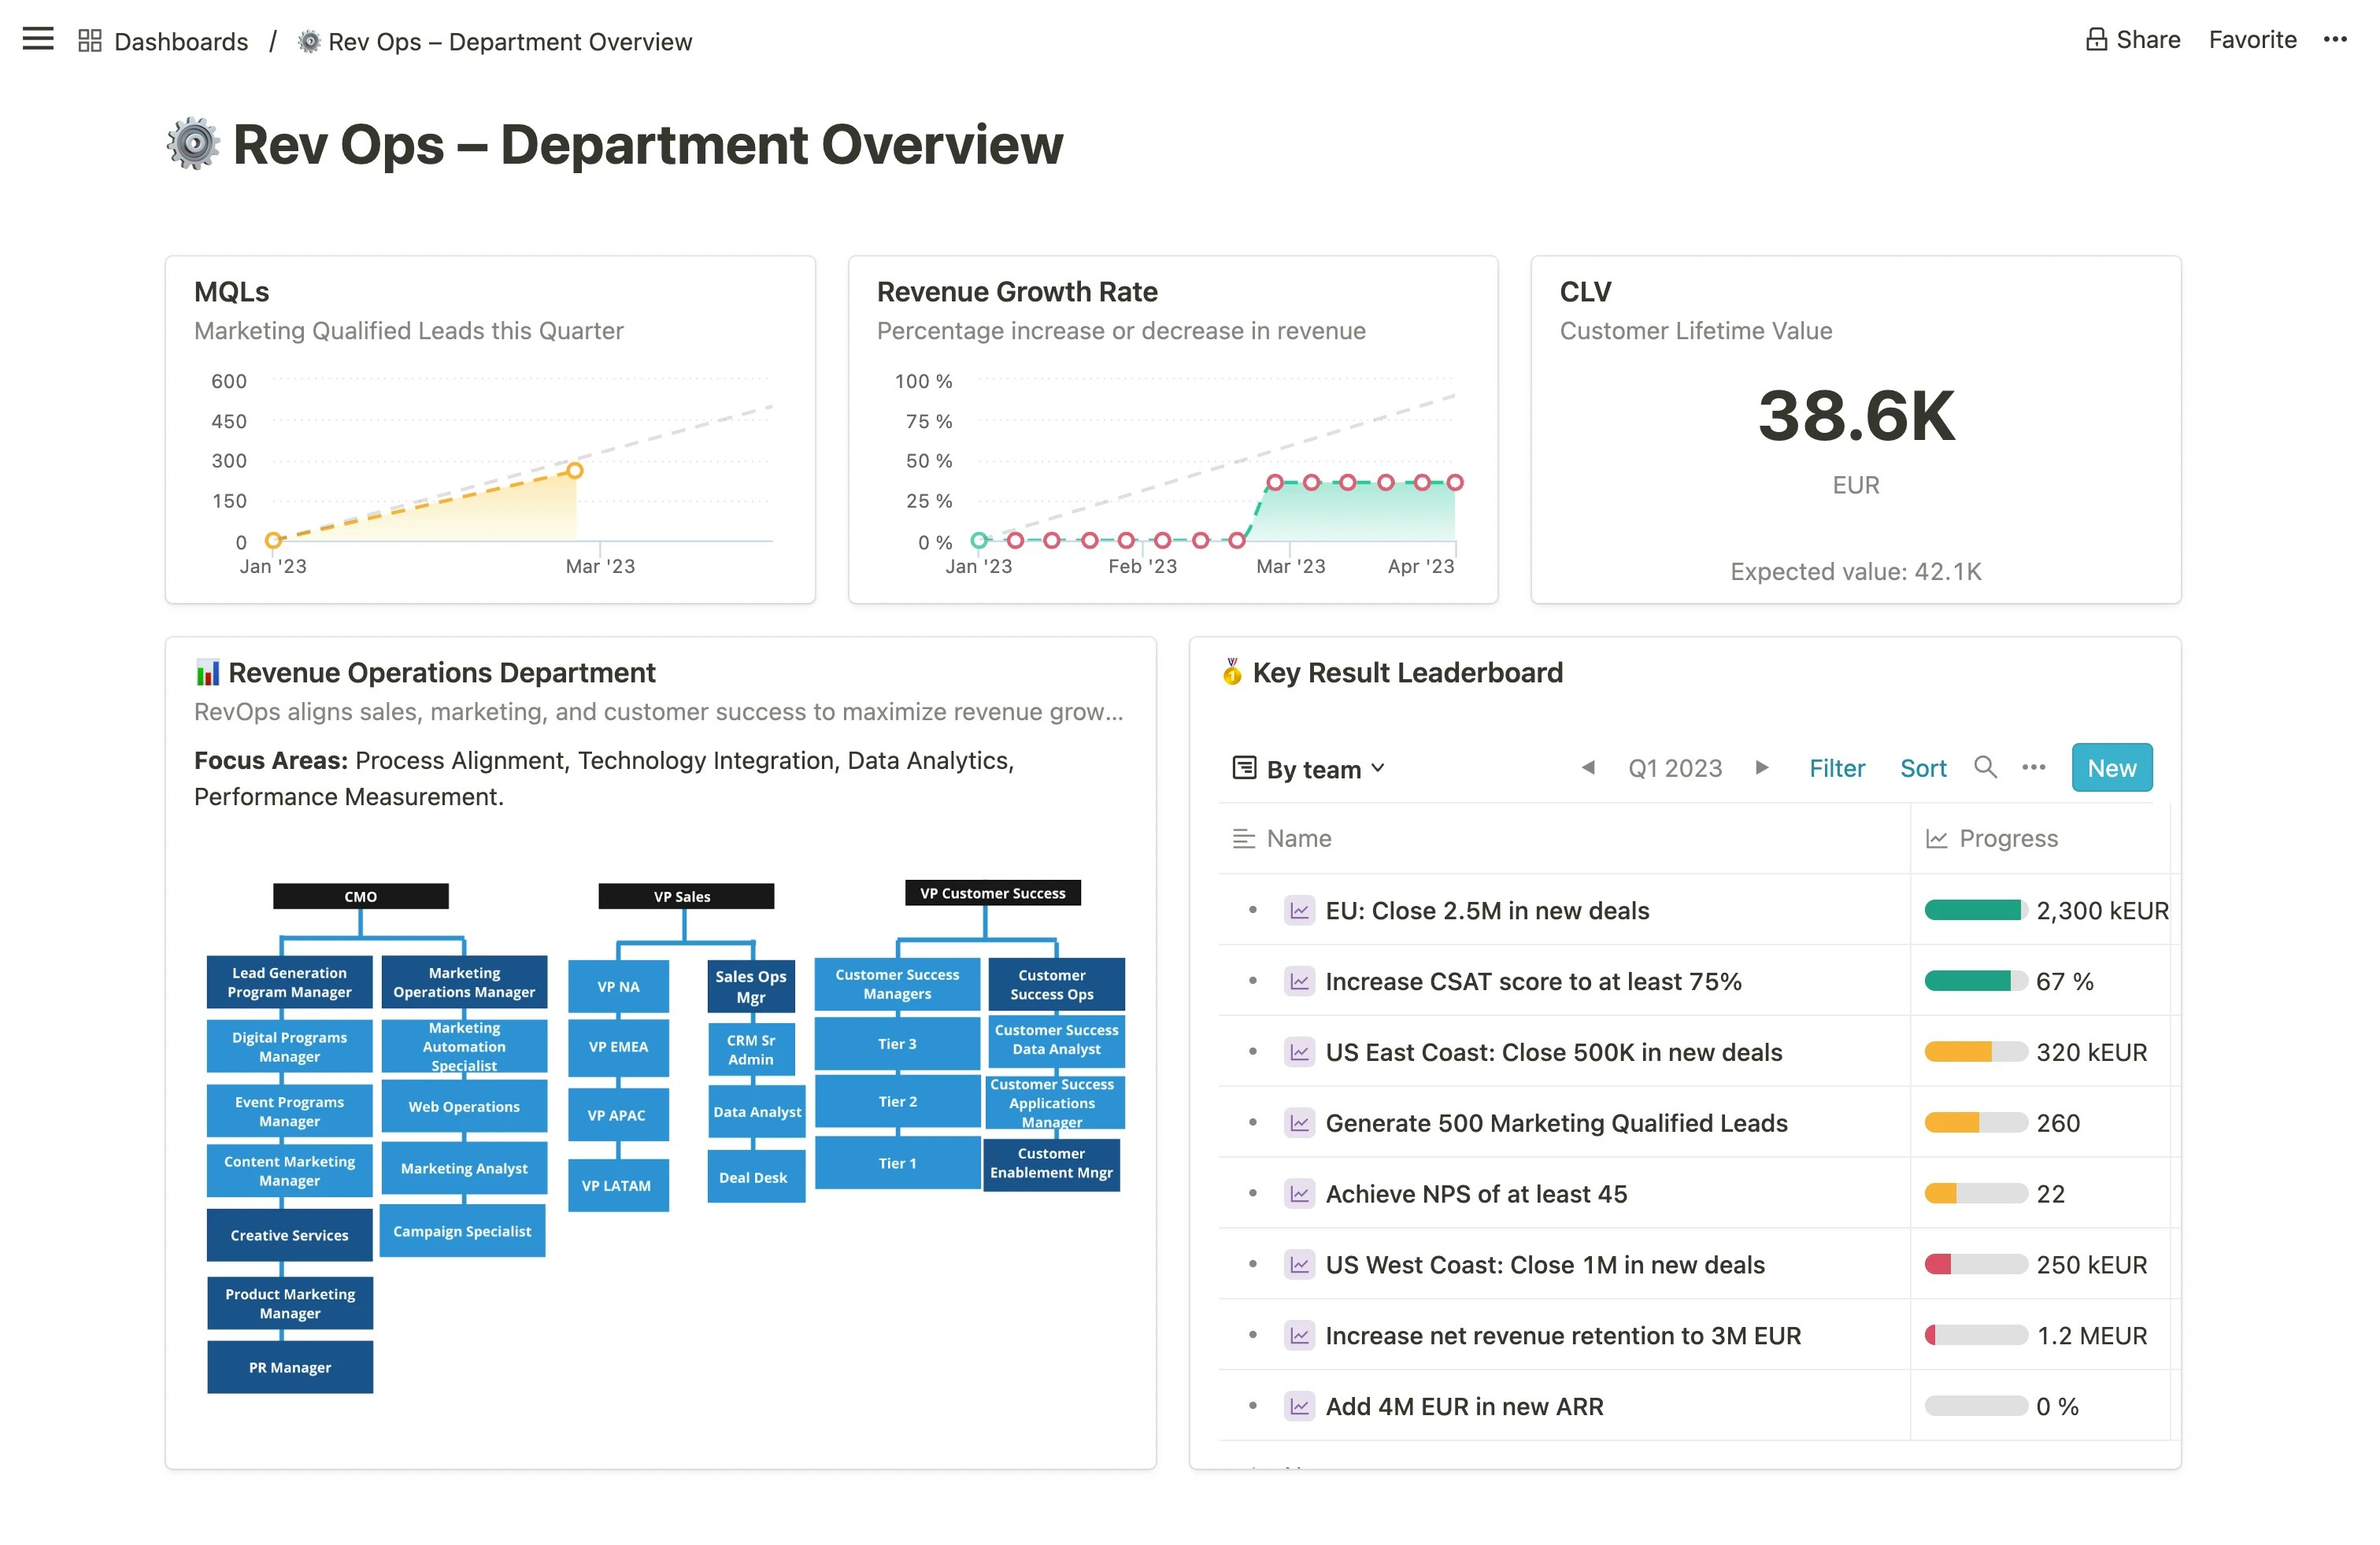
 * **Department Overview:** A comprehensive snapshot of a department's mission, key metrics, goals, team members, and other possible reports, like OKR leaderboards.
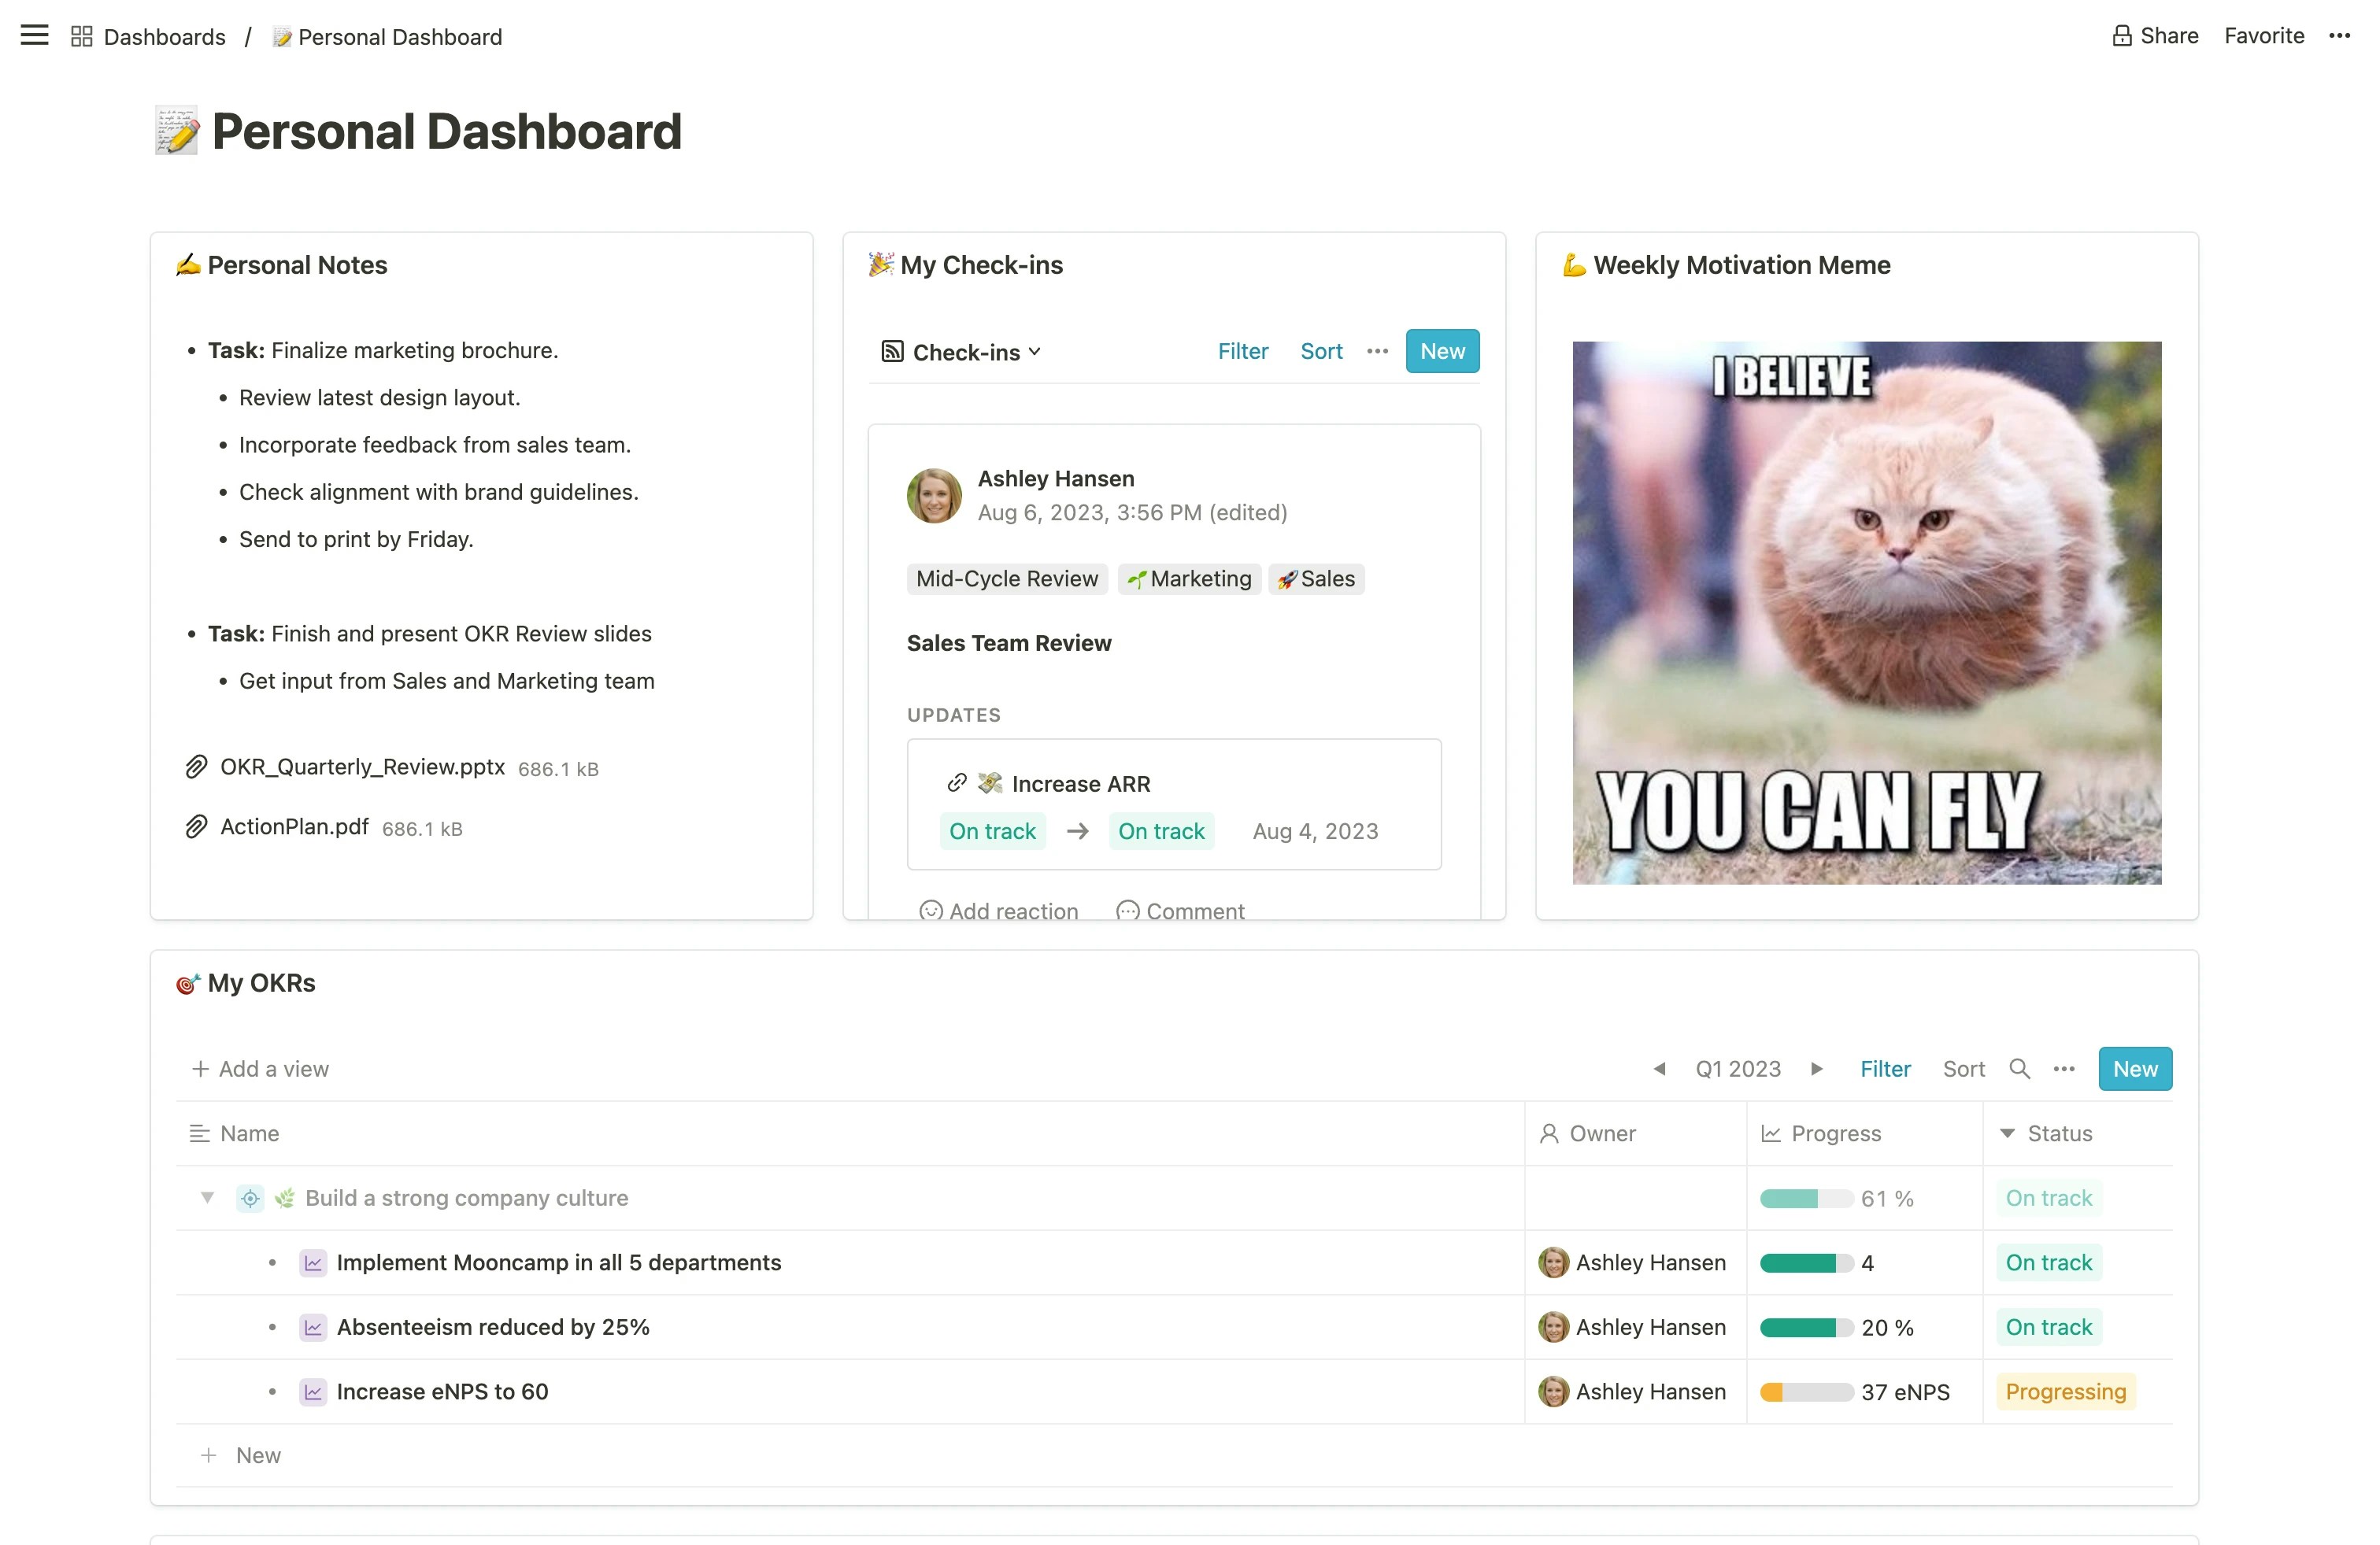
 * **Personal Dashboard:** A tailored view featuring individual OKRs, your check-ins, personal notes, relevant files, and quick links to your team members' public profiles.
 ## iframe embed
The data integration via iframe lets you embed external content directly on your custom dashboards. It is possible to add live views from almost every tool like Power BI, Tableau, Miro, Excel, Google Sheets and Docs, Looker Studio, Powerpoint or Google Slides, and many more.
You can use iframe embeds to add context and display real-time data on your dashboards. This way you have all your most important data and insights in one place, without the need to switch between apps.
### How to set up an iframe embed
Any user with the right to create custom dashboards can enable an iframe embed by following these steps:
1. Access the Dashboards area via your sidebar under `Tools`.
2. Enter one of your custom dashboards from the list or create a new one.
3. Click the `+Add content` button and use the `<>` Embed option from the list.
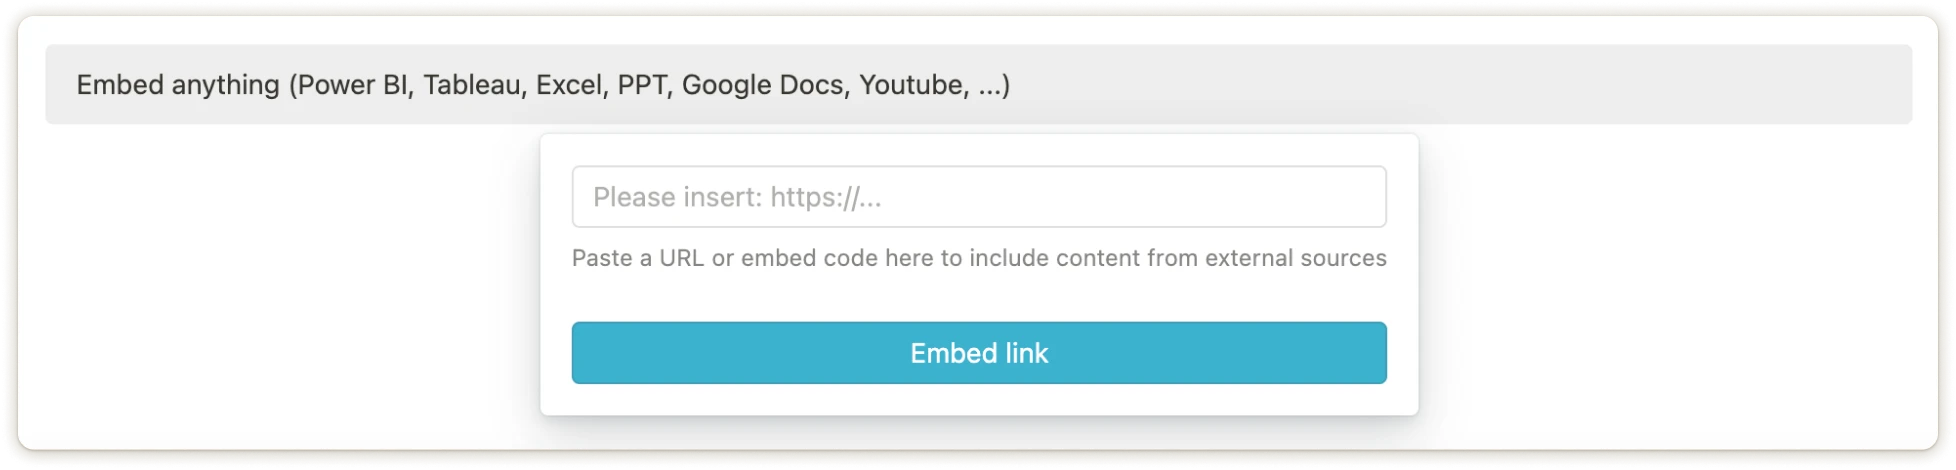
4. Paste your URL of the original data or embed code to include your content of choice.
## iframe embed
The data integration via iframe lets you embed external content directly on your custom dashboards. It is possible to add live views from almost every tool like Power BI, Tableau, Miro, Excel, Google Sheets and Docs, Looker Studio, Powerpoint or Google Slides, and many more.
You can use iframe embeds to add context and display real-time data on your dashboards. This way you have all your most important data and insights in one place, without the need to switch between apps.
### How to set up an iframe embed
Any user with the right to create custom dashboards can enable an iframe embed by following these steps:
1. Access the Dashboards area via your sidebar under `Tools`.
2. Enter one of your custom dashboards from the list or create a new one.
3. Click the `+Add content` button and use the `<>` Embed option from the list.
4. Paste your URL of the original data or embed code to include your content of choice.
 ### Automatic Updates
Once the iframe is embedded, Mooncamp automatically updates your data based on changes in the tool of origin.
### Automatic Updates
Once the iframe is embedded, Mooncamp automatically updates your data based on changes in the tool of origin.