> ## Documentation Index
> Fetch the complete documentation index at: https://mooncamp.com/docs/llms.txt
> Use this file to discover all available pages before exploring further.
# Views
> An overview of Views for goals, check-ins, and dashboards
With views, you can filter your **goals**, **check-ins**, or **dashboards** for specific criteria or properties and save the outcomes in a so-called view. You can create private views on your personal homepage or, if authorized, a public view on your team spaces.
Currently, you can create these types of views for **goal databases**:
* Cascade (nested table)
* List
* Goal Tree
* Network
On **check-in databases**, you can create these types of views:
* Feed
* List
On **dashboard pages**, you can only add dashboard views.
Each view type offers unique benefits for different use cases. These are just a few things you might want to do with views:
* Filtering for specific off-track goals that you are involved in
* Keeping an eye on important strategic initiatives and their health
* Regularly checking the goals of certain teams or team members
Lastly, it is also possible to add a view to the '**Favorites**' section of your sidebar or [**export**](/exporting-content) selected views as PDF, PNG, or CSV, or share them as a [public link](/public-links).
## How to use views
If you don't feel like reading, we have recorded a video tutorial for you. It provides a general overview of views in Mooncamp.
## Where can I create a view?
You can create views in the following places:
* Home (views are private to you)
* Teamspaces
* Goal Explorer
* Check-in Explorer
* Dashboards
* Progress Dashboard
* Health Dashboard
* Custom Dashboards (on tiles)
## Views permissions
Views on the goal explorer are visible to all users in your organization. Views on teamspaces are visible to all users that have at least view access to the teamspace. In every area where views can be created, they will be accessible to everyone. On the **goal explorer**, every view can be published (and unpublished) as a [public link](/public-links) via the ellipsis `...` in the top right corner (only available on the `Enterprise` plan).
**Please note:** By default, only an admin can create views. Additionally, the admin can grant access groups the right to do so via `Settings > Access groups > Account administration > Management of public views`.
## How can I create and edit a view?
### Creating a view
To create a view, click on the `+` in the database header, give your view a name and choose a view type.
Now you can modify your view, e.g., by
* adding filters
* adding sorting options
* displaying or hiding properties
* reordering columns
* wrapping cells
* etc.
### Editing and deleting a view
Once you have added a new view, you can edit its name, icon, and type by clicking on its name again. Here, you can also delete the view, if needed.
## Views for goal databases
Views for goals can be created on your [homepage](/homepage), on [teamspaces](/teamspaces), and the [Goal Explorer](/goal-explorer). On your **homepage**, goals are already pre-filtered to show all goals that are related to your user account. On a **teamspace**, goals are pre-filtered to show the respective team's goals only.
In the Goal Explorer, you can [export](/exporting-content) **any goal view** as **PDF**, **PNG**, or **CSV**. CSV exports include data like title, creator, latest update, current value, status, and all related properties (excluding update history or comments). Additionally, every public view can be exported as a **public link** accessible to non-users. For public link details, see [this article](/public-links).
Other than this, views for goals function the same everywhere.
### Goal view types
Displays goals in a nested table to show the hierarchy of goals at various levels.
Shows all goals in a simple flat list.
Offers a visual map of goals and OKRs, showing strategic pillars and initiatives in a hierarchical view.
Displays goals in a network view, showing the relationships between goals and their alignments.
## Views for Check-ins
Views for check-ins can be created in the check-in explorer. Here you have two view types:
The feed basically shows the same info as a list, however, displays each check-in in the form of a card. This makes it possible to show the content of a check-in, such as free-text replies to template questions and goal updates. This view is ideal if you would like to screen the content directly and it is even possible to react with an emoji for praise or a comment for questions or discussions.
Shows all check-ins in a simple flat list. You can choose to display properties like the team, the creator, the creation date, or the template title.
### Check-in view settings
In the upper right corner of your check-in view, there are a number of settings including options to filter, sort, or display check-ins and their properties for your views. You can filter for team, creation date, and the creator of a check-in, and as everywhere, filters can be combined via AND and OR. Sorting is possible ascendingly or descendingly for the creation date. Editable properties to display include the team of a check-in and the title of the template that was used.
## Views for dashboards
Views can be created for the [Progress Dashboard](/progress-dashboard) and the [Health Dashboard](/health-dashboard) with the same setting options for both dashboard types. For the [Progress Dashboard](/progress-dashboard), there is an additional `Compare to` function, which gives you the possibility to compare your current data to the past.
On a [**Custom Dashboard**](/dashboards), it is possible to create tiles that show different data. For every list-type tile (goals, check-ins, update feed, members), it is possible to create a view with differing filter, sort, and display settings.
## Pin views as a favorite to your sidebar
Views can be saved as a favorite and, in this way, be added to the sidebar just above your Teamspaces.
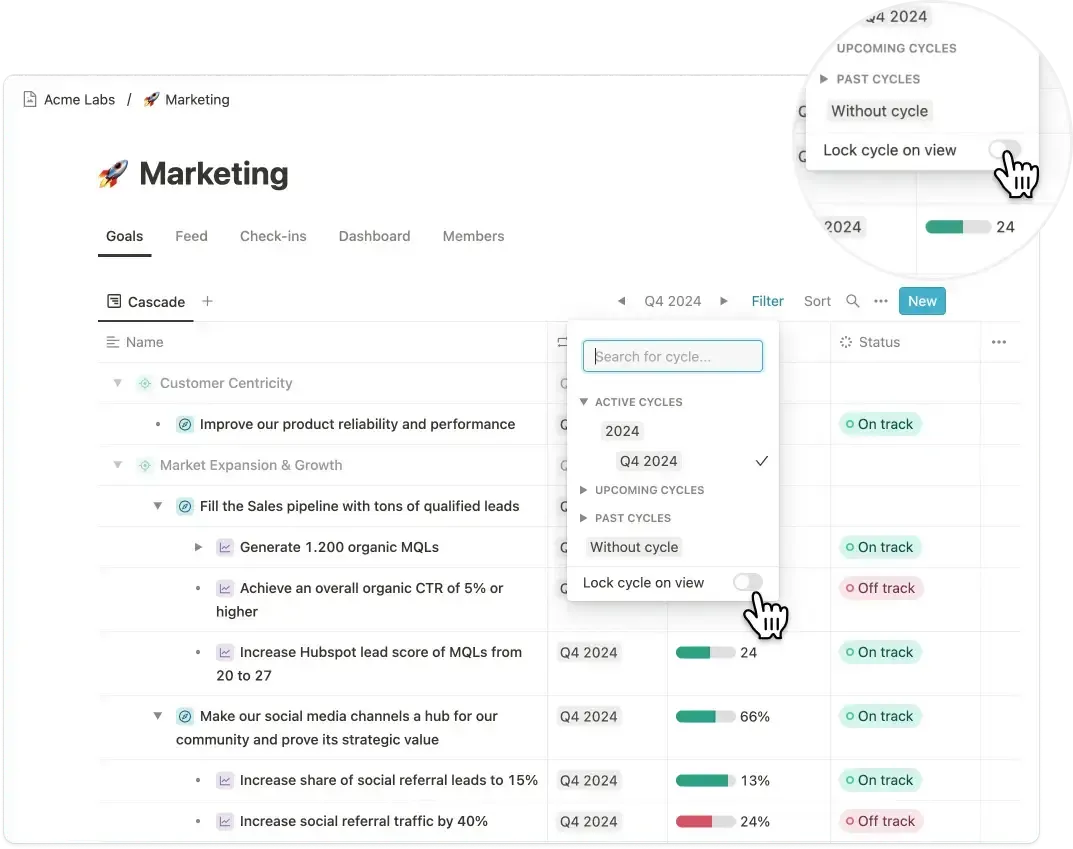
## Views and cycles
Per default, the currently selected cycle is globally applied to every view. However, you can lock a cycle within a view, ensuring that users see the exact data you want them to see on goal tables or dashboards. If no cycle is locked, the currently selected cycle for each user will apply automatically.
 To learn more about cycles, you can read [this article](/cycles).