The reporting engine for your strategy
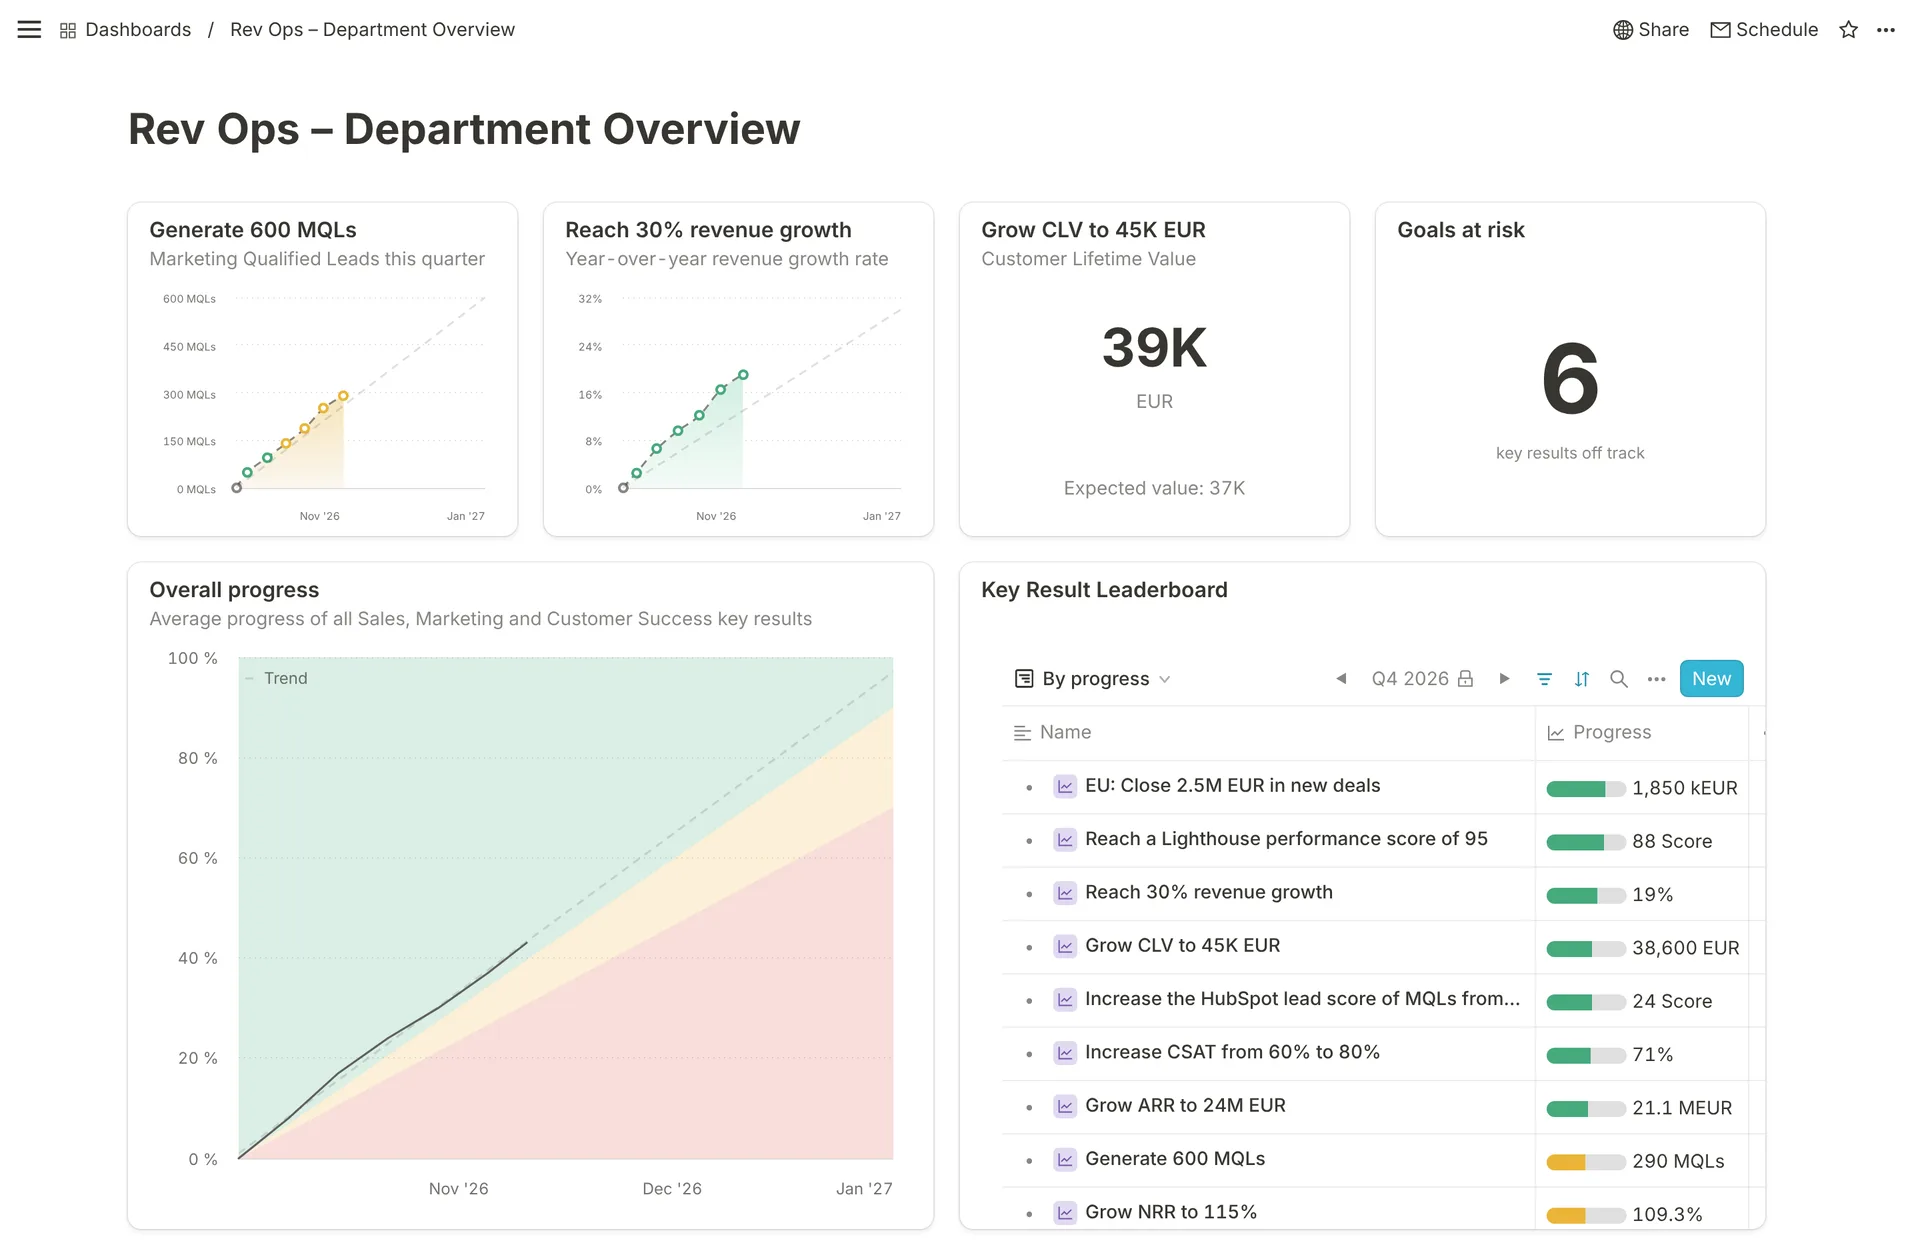


Gain insights into your strategy and operations
Track your progress
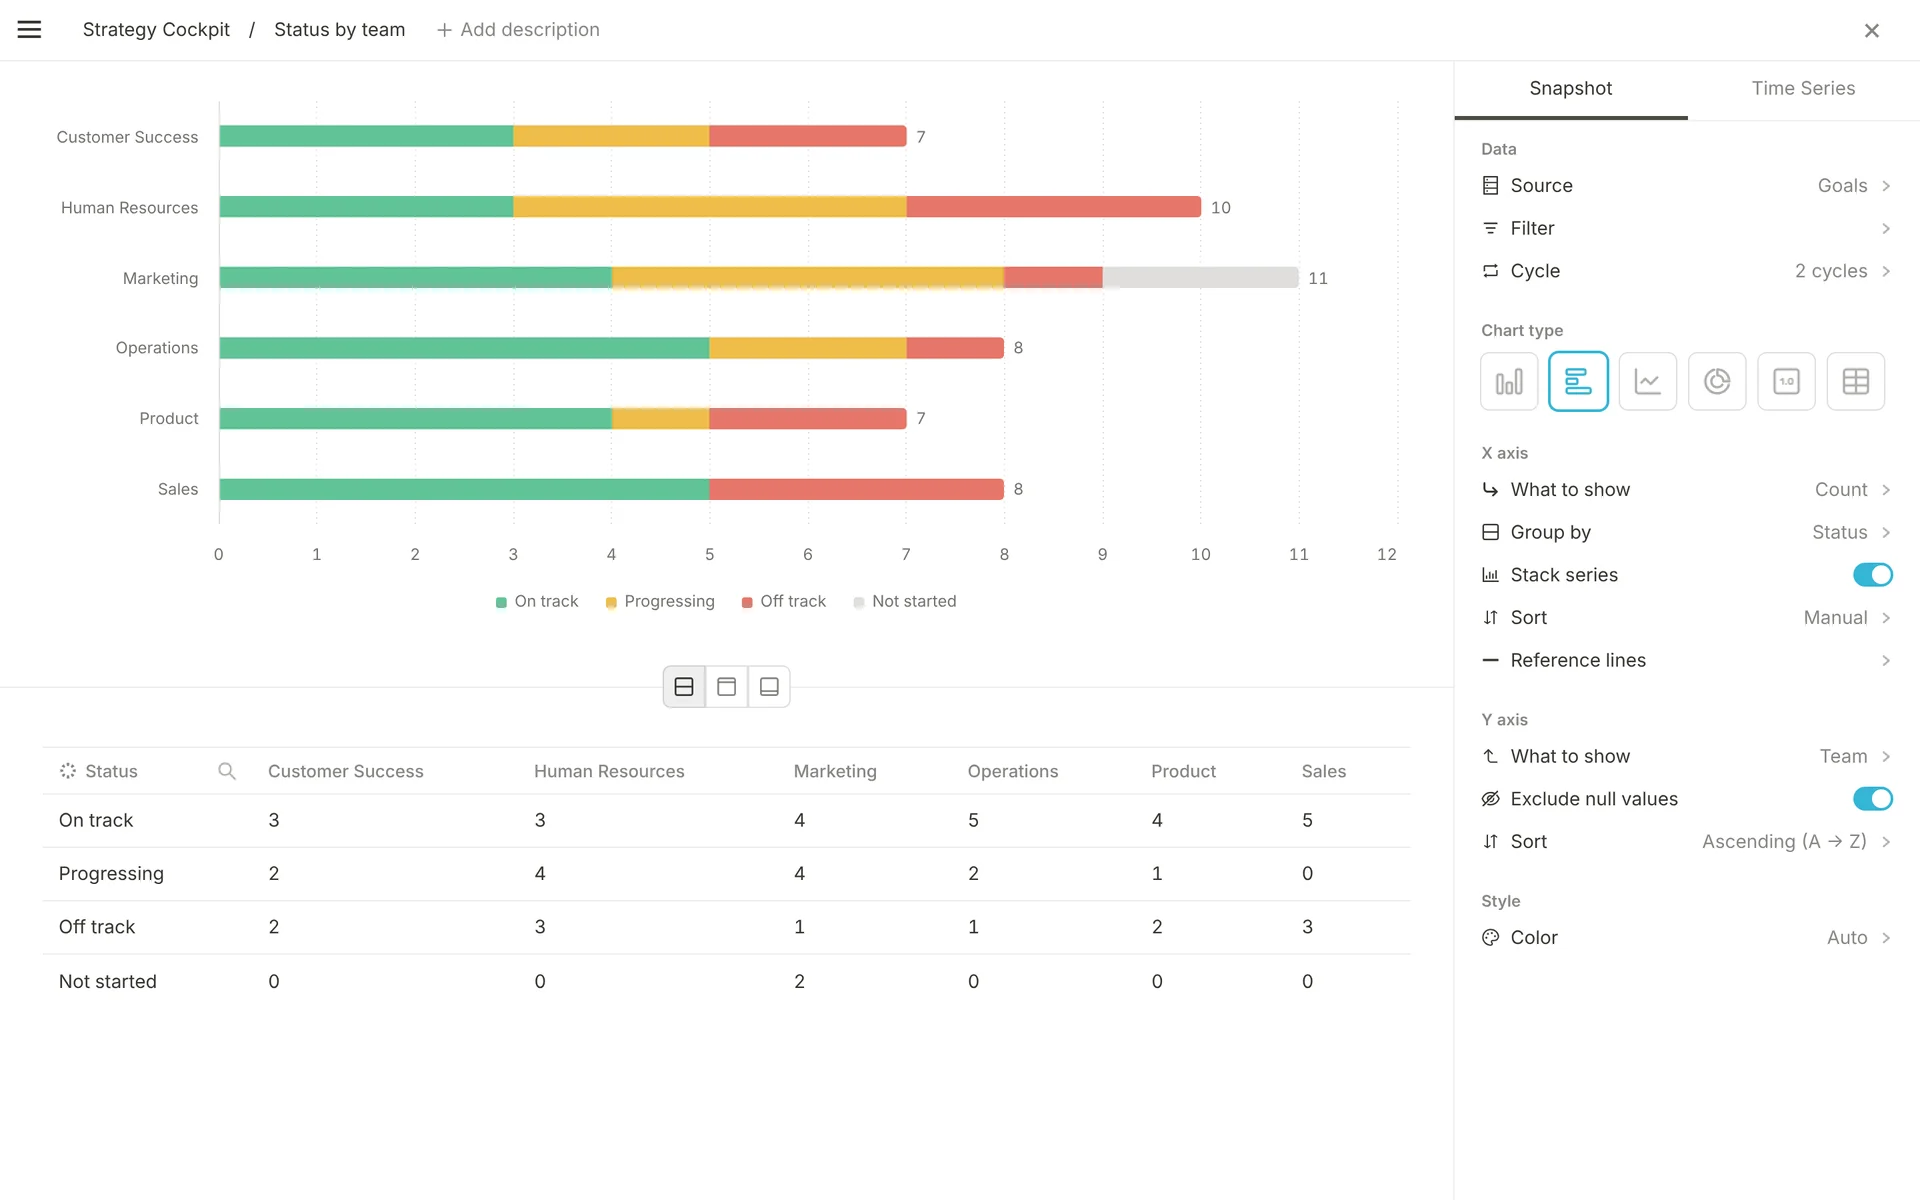
Break down your progress by department, identify goals at risk, and track your teams' confidence of achieving their goals.
Know early if you are on track
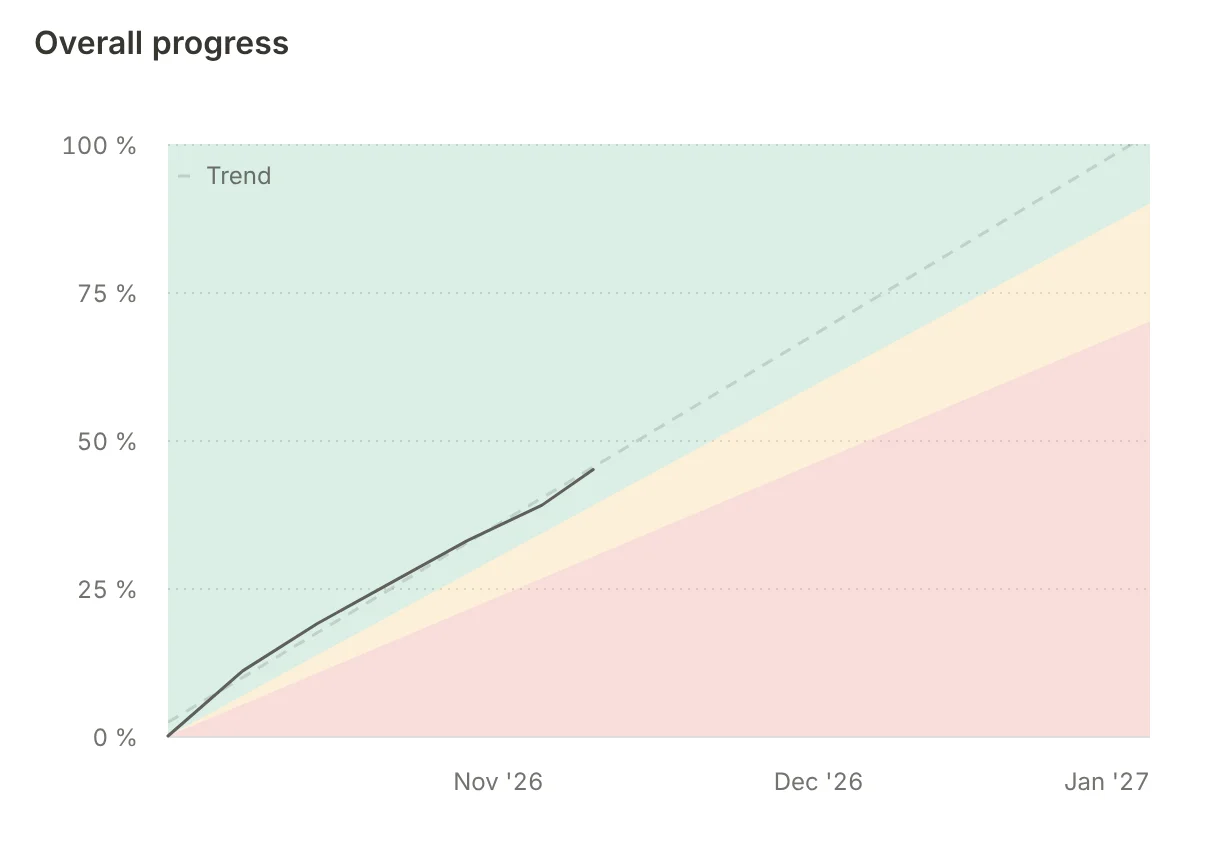
Compare actual progress with where you should be today, so a slow quarter shows up while there is still time to act.
See where teams need support
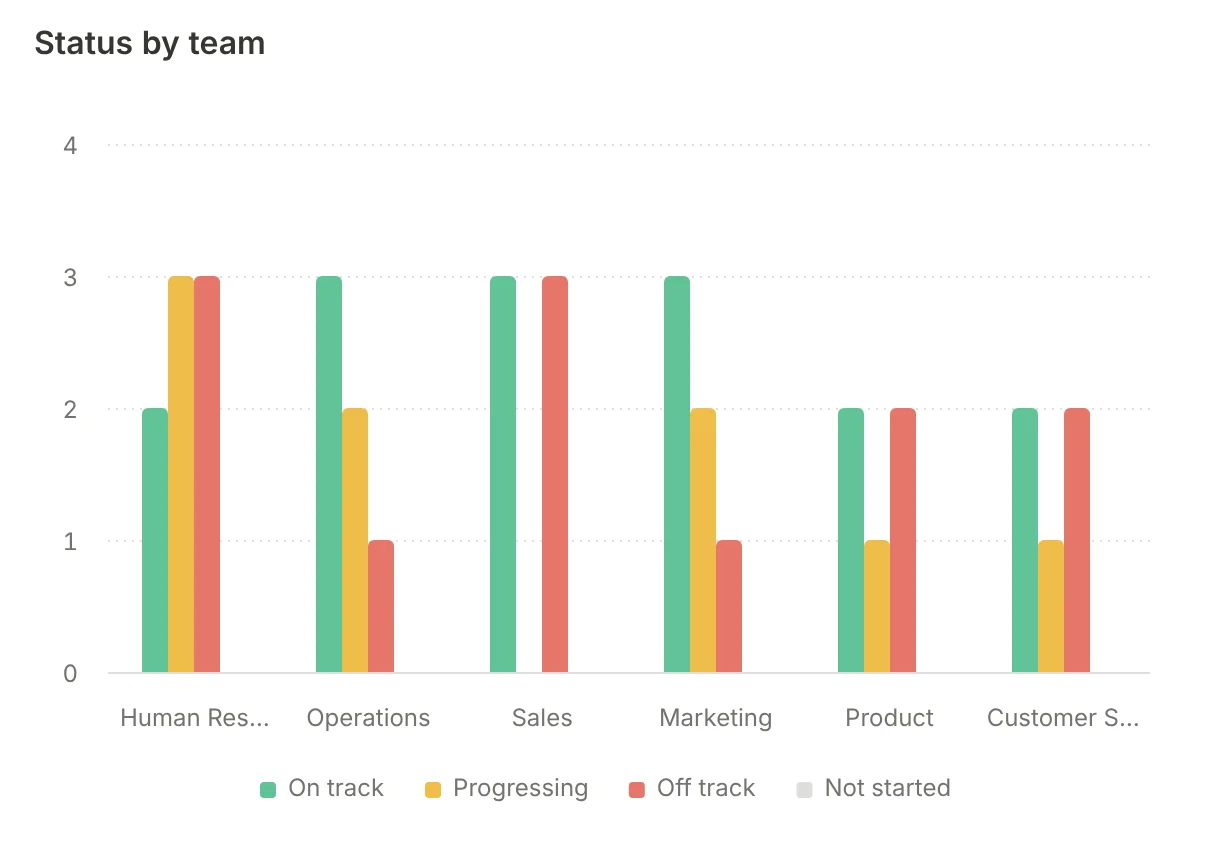
Break down progress and status by team, owner or initiative and spend your review time where it matters.
We use Mooncamp for our OKR reporting up to the board level. With the completely customizable dashboards and reporting features, our managers have the best support.

Infinite use cases for your dashboards
From question to report in minutes
Turn the questions from your last strategy review into charts, right where your goals and check-ins live. No spreadsheet exports, no waiting for the BI team.
Business KPIs
Enable business observability and data-driven decision-making by tracking KPIs across all departments.

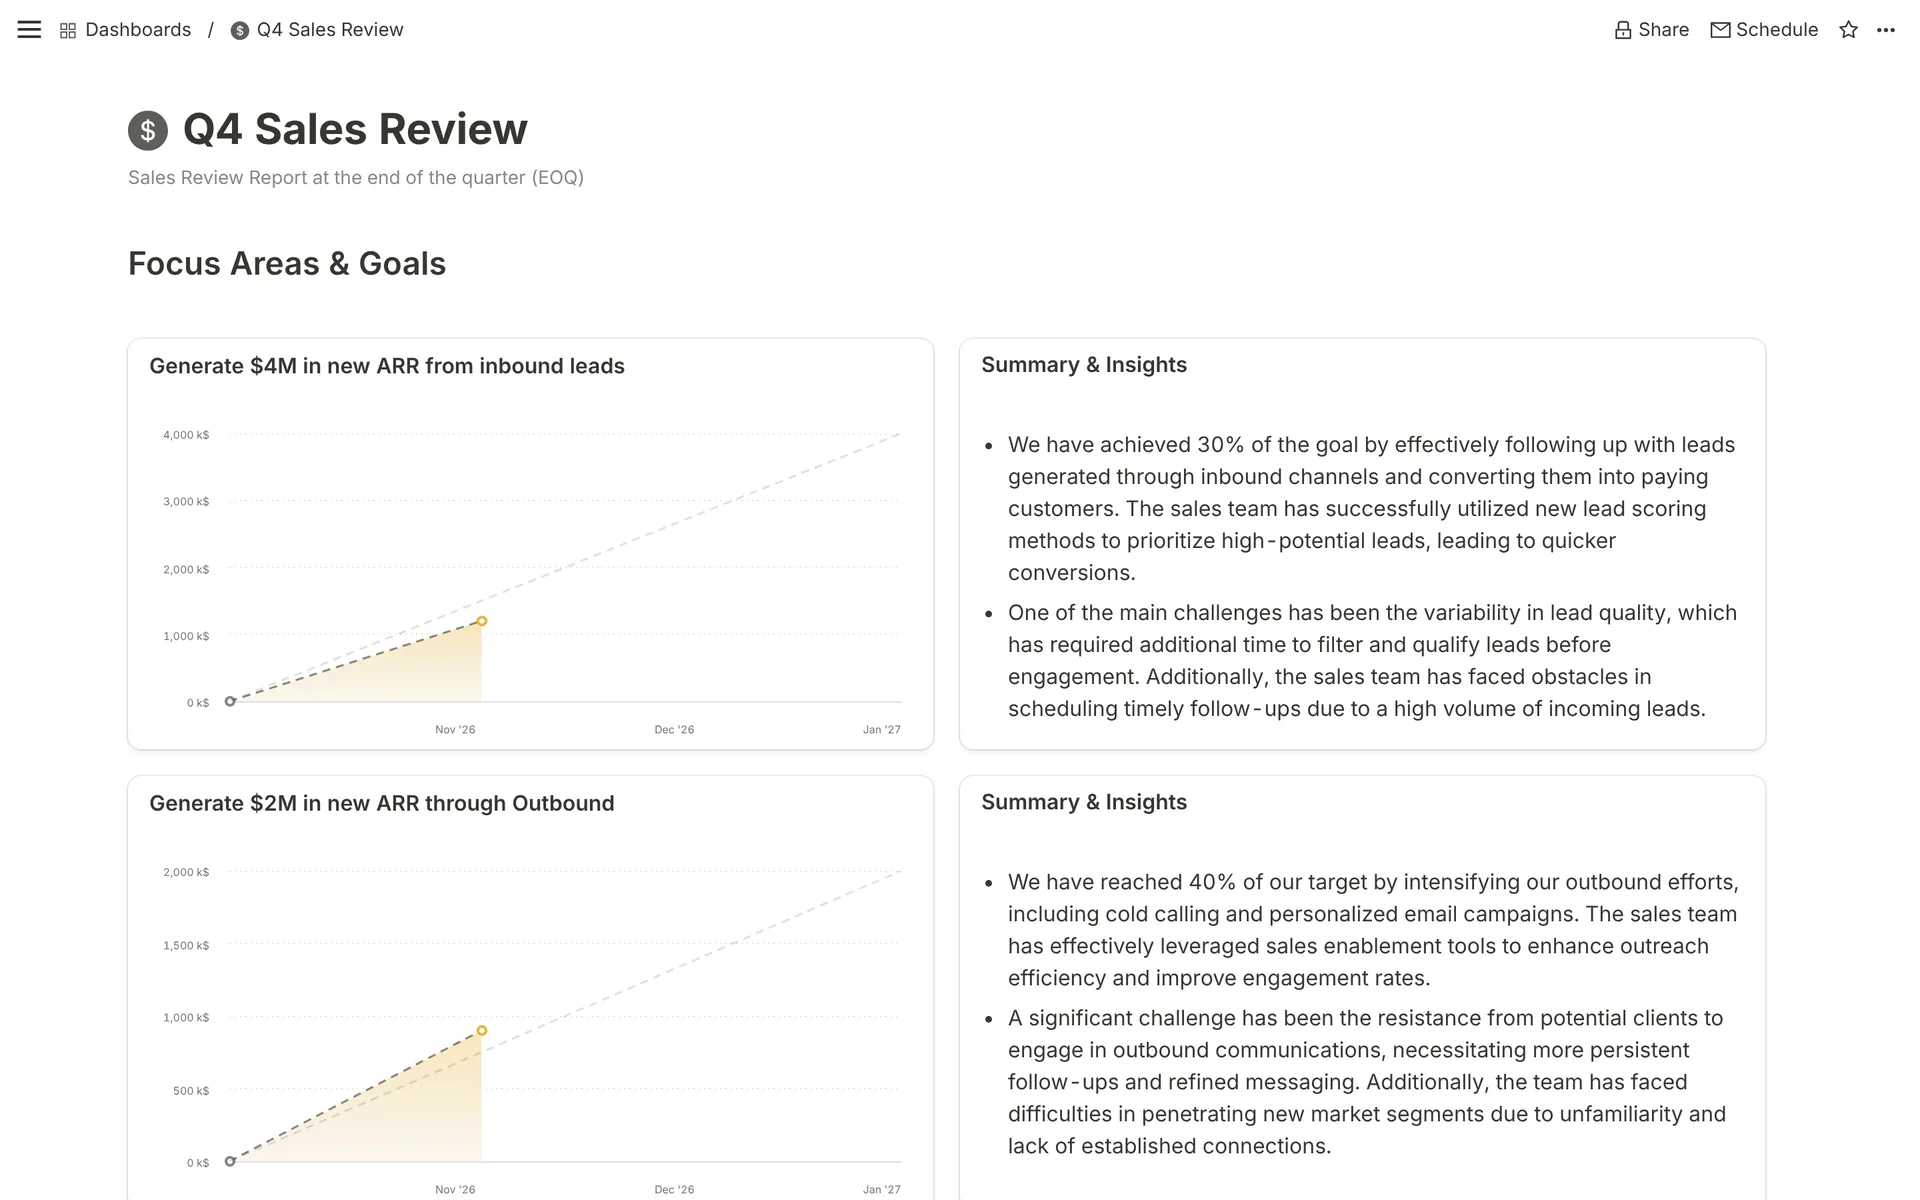
Quarterly Business Review
Analyze your quarterly achievements, growth, challenges, strategic initiatives, as well as OKR highlights and lowlights.
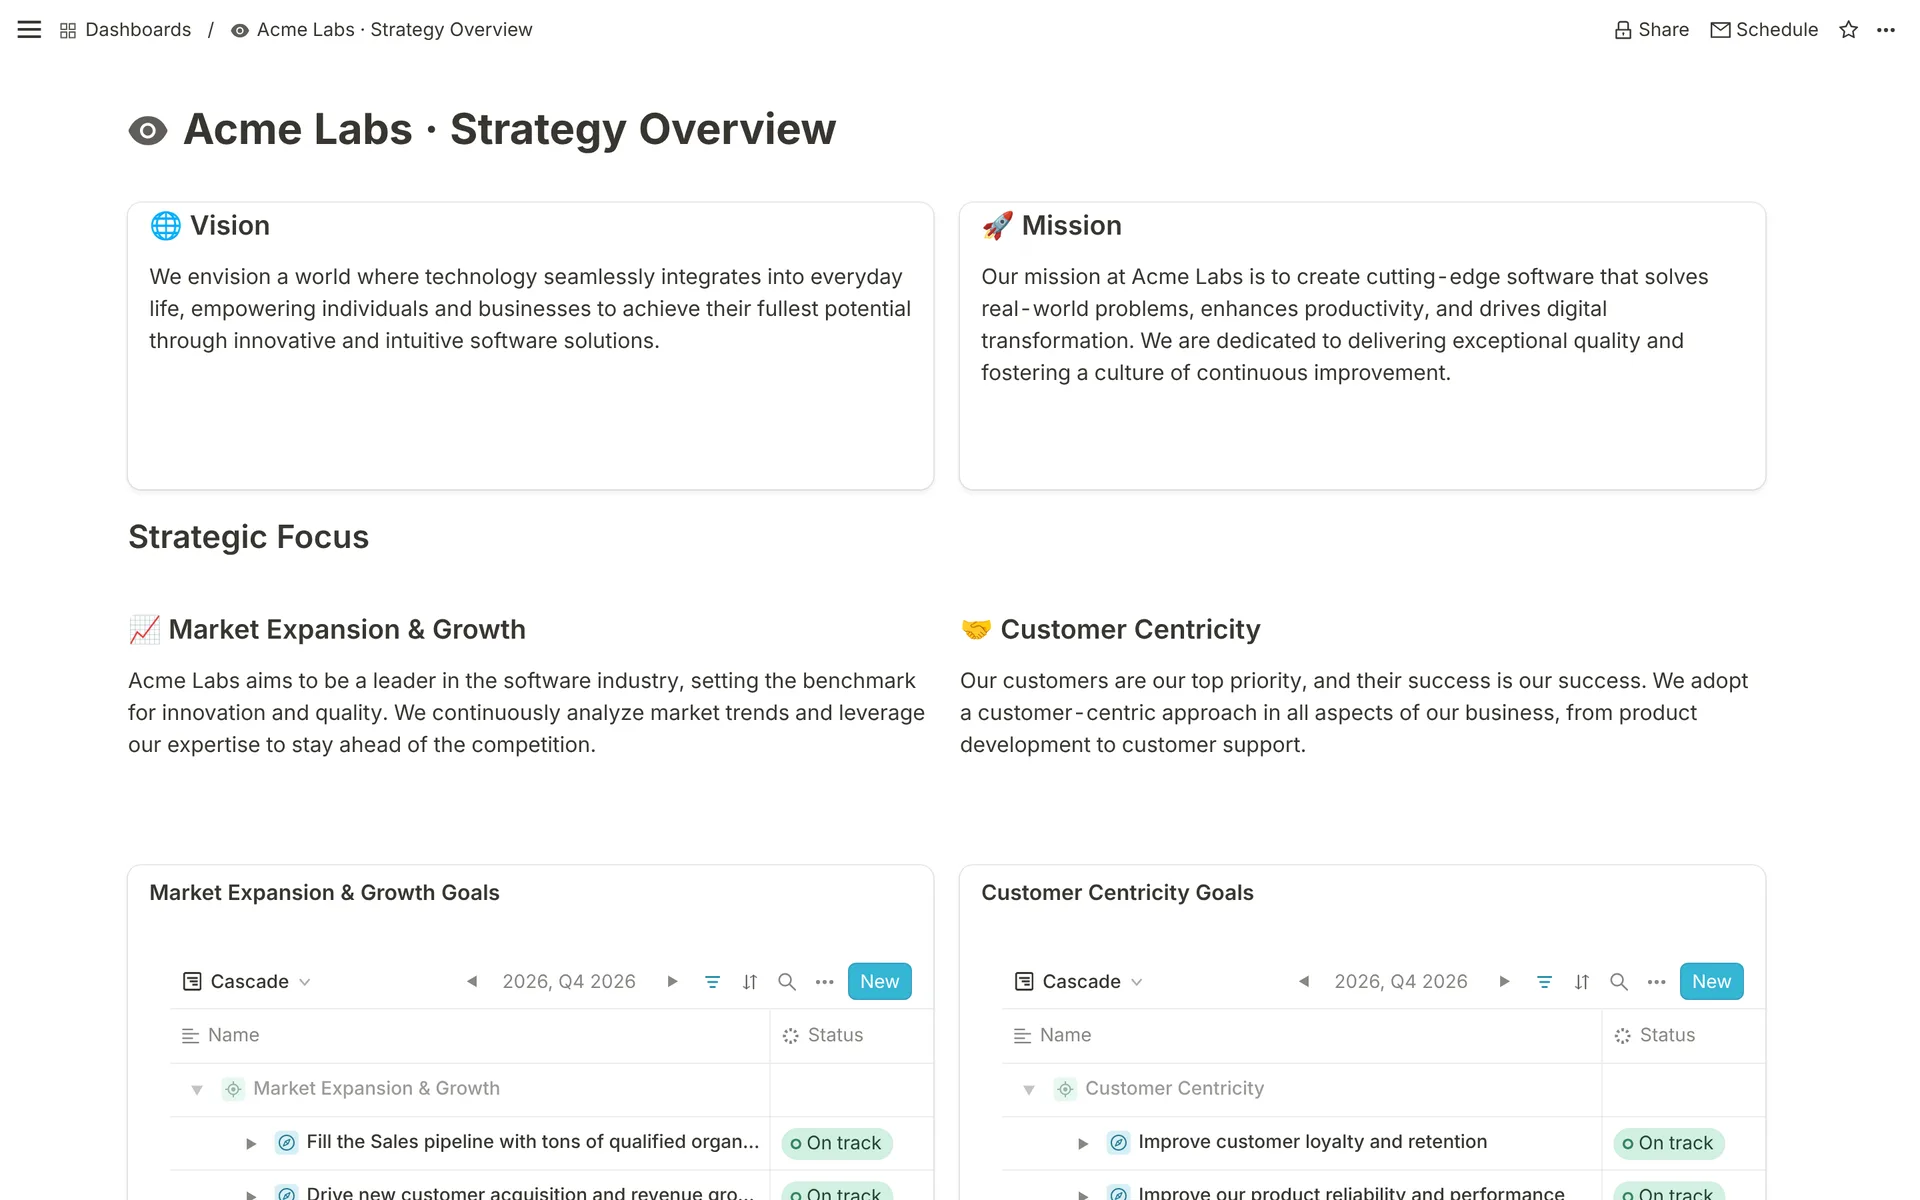
Company Cockpit
An executive summary encapsulating the company's vision, mission, and values, as well as top-level KPIs and overall OKR progress.
Weekly Management Report
A report that highlights key accomplishments, challenges, and focus areas for the week, aiding in short-term decision-making and planning.

Monitor the health of your strategy process
Ensure adherence to your goal system
Conduct a health and quality check for all of your company's goals and recognize problems with the process early on.

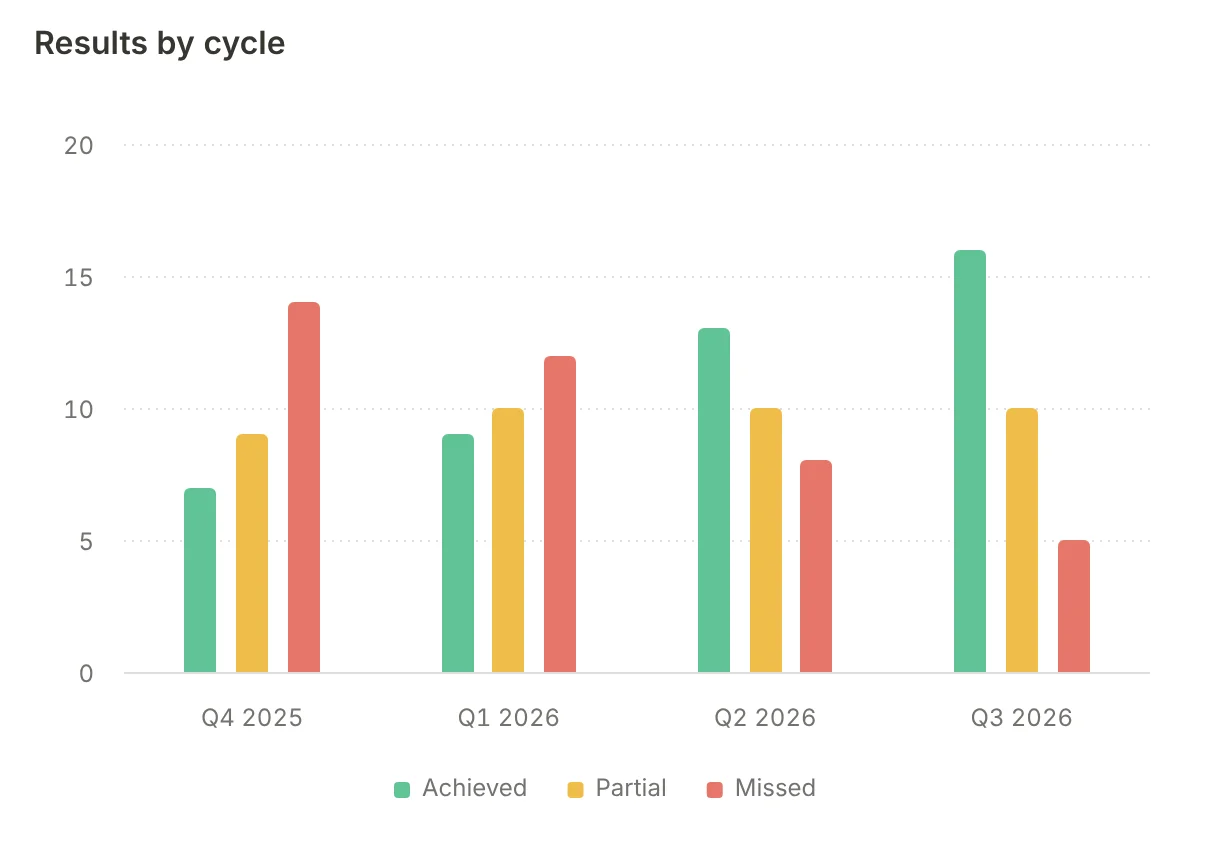
Learn from every cycle
Compare how many goals you achieved, partly achieved or missed in each cycle, and see whether your targets get more realistic over time.
Keep your check-in rhythm
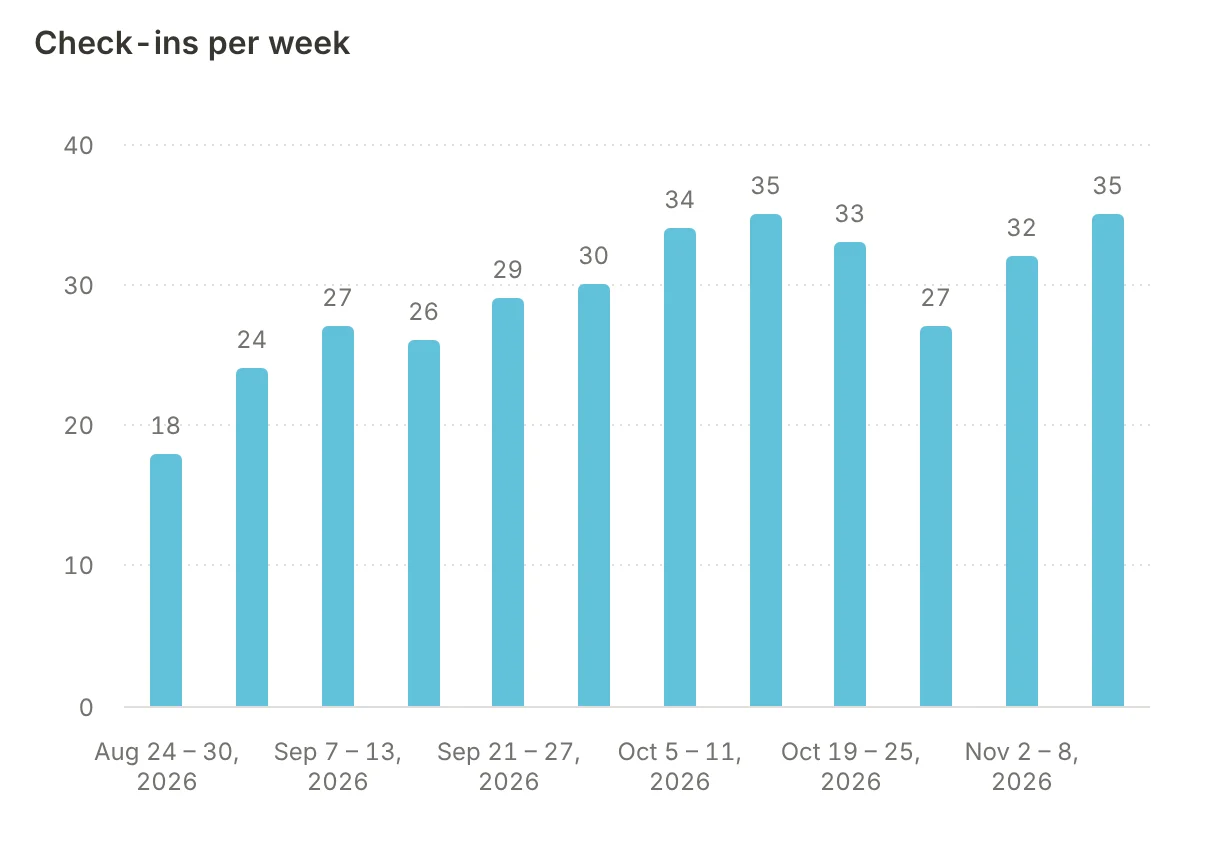
See how many check-ins come in each week and notice a slipping rhythm before your goals go stale.